GEOS-Chem v10-01 benchmark history
On this page we have posted complete information about all benchmark simulations (both 1-month and 1-year) for GEOS-Chem v10-01.
Contents
1-year benchmarks
v10-01i-Run0
Three GEOS-Chem model versions were compared to each other:
| Color | Quantity Plotted | Met Type | Year | Emissions | Chemistry mechanism | Annual Mean OH [105 molec/cm3] |
|---|---|---|---|---|---|---|
| Red | v10-01e-Run1 | GEOS-FP, 72L, 4x5 |
2013 | HEMCO emissions component, with the following update included: | UCX chemistry mechanism, includes: | 11.843 |
| Green | v10-01h-Run0 | GEOS-FP, 72L, 4x5 |
2013 | HEMCO emissions component updates:
|
" " | 11.092 |
| Blue | v10-01i-Run0 | GEOS-FP, 72L, 4x5 |
2013 | HEMCO emissions component fixes:
|
" " | 11.125 |
| Black | Observations |
The output plots for Run0 (both PostScript and PDF format) may be downloaded from:
ftp ftp.as.harvard.edu
cd gcgrid/geos-chem/1yr_benchmarks/v10-01/v10-01i/Run0/output
mget *
You may also view the PDF files online by pointing your browser to
http://ftp.as.harvard.edu/gcgrid/geos-chem/1yr_benchmarks/v10-01/v10-01i/Run0/output/
--Melissa Sulprizio 17:03, 28 April 2015 (EDT)
Comments about the 1-year benchmark v10-01h
Randall Martin wrote:
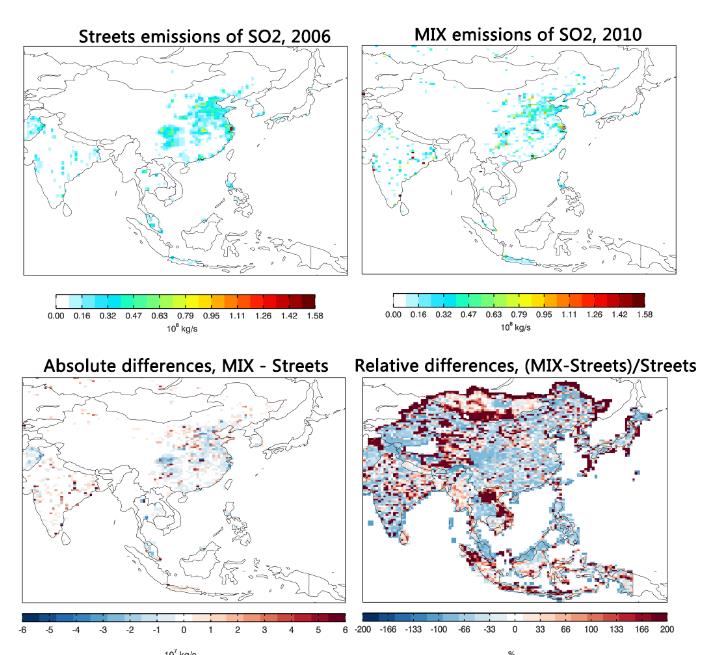
- Could there be an error in SO2 emissions that goes beyond MIX? In this plot (top left) I see more than a factor of 2 reduction in anthropogenic SO2 emissions in many regions worldwide.
- Something similar appears to happen for NO, but the global emission totals for NO increase.
    ANTHROPOGENIC + BIOFUEL
     Tracer   v10-01e-geosfp-Run1   v10-01h-geosfp-Run0   v10-01i-geosfp-Run0
    ============================================================================
          NO            27.761212             30.087867             30.639205    Tg N
         SO2            48.892838             38.464923             38.087385    Tg S
Melissa Sulprizio wrote:
- HEMCO has the capability to calculate total emissions per inventory, so I used that feature to diagnose how the emission inventories are changing between v10-01f, v10-01h, and v10-01i to see if that can explain the differences showing up in the benchmarks. Please see the attached comparisons for the SO2 anthropogenic emission inventories and NO anthropogenic emission inventories. The year column in the tables represents the base year of the emission inventory, which has changed for many of the inventories.
- Anthropogenic SO2 emissions decrease for most of the updated inventories (EDGAR, NEI2011, EMEP), which would help explain the global decrease in SO2 concentrations. MIX shows an increase in the SO2 emission totals, but that is likely dominated by the increase in Indian SO2 emissions and the inclusion of Russia. As we see from the emission difference maps, SO2 emissions generally decrease over China. We used the old mask file that included Russia for v10-01h and v10-01i, so Russian emissions are still included here. We have applied the new MIX mask file as a last-minute fix for the v10-01 release.
- The increase in global NO emissions is primarily driven by EMEP and AEIC emissions. There may be a problem in the IDL routine for calculating the anthro+biofuel totals for NO (I’m looking into this). In the NOx sources table in that same file, we don’t see large differences in the individual NO anthropogenic sources:
    NOx SOURCES
    Tracer   v10-01e-geosfp-Run1   v10-01h-geosfp-Run0   v10-01i-geosfp-Run0
    ============================================================================
       NOac             0.814670              0.814732              0.819548    Tg N
    NOan+bf            30.075295             30.087867             30.918083    Tg N
--Melissa Sulprizio 12:55, 6 May 2015 (EDT)
v10-01h-Run0
Three GEOS-Chem model versions were compared to each other:
| Color | Quantity Plotted | Met Type | Year | Emissions | Chemistry mechanism | Annual Mean OH [105 molec/cm3] |
|---|---|---|---|---|---|---|
| Red | v10-01c-Run1 | GEOS-FP, 72L, 4x5 |
2013 | Same as v9-02r-geosfp-Run1 | UCX chemistry mechanism, includes: | 11.885 |
| Green | v10-01e-Run1 | GEOS-FP, 72L, 4x5 |
2013 | HEMCO emissions component, with the following update included: | " " | 11.843 |
| Blue | v10-01h-Run0 | GEOS-FP, 72L, 4x5 |
2013 | HEMCO emissions component updates:
|
" " | 11.092 |
| Black | Observations |
The output plots for Run0 (both PostScript and PDF format) may be downloaded from:
ftp ftp.as.harvard.edu
cd gcgrid/geos-chem/1yr_benchmarks/v10-01/v10-01h/Run0/output/pdf
mget *
You may also view the PDF files online by pointing your browser to
http://ftp.as.harvard.edu/gcgrid/geos-chem/1yr_benchmarks/v10-01/v10-01h/Run0/output/pdf/
--Melissa Sulprizio 11:36, 13 April 2015 (EDT)
Comments about the 1-year benchmark v10-01h
Jeff Pierce wrote:
- There are huge changes in dust and some in sea-salt. I'm not sure why these changed at all. There are some non-trivial changes to other aerosol species, but these could be due to the emissions inventory changes.
Melissa Sulprizio wrote:
- The changes in dust and sea salt may attributed to the meteorology fields. In the previous 1-year benchmarks we ran for 2013/01 – 2013/08 then 2012/08 – 2013/01. We did that because of met field and OTD-LIS factor availability for GEOS-FP at the time. We have since downloaded the GEOS-FP met fields for all of 2013 and in this version (v10-01h) we updated the OTD-LIS factors for GEOS-FP through October 2014. Therefore, for this 1-year benchmark simulation we were able to run for the entirety of 2013.
Christoph Keller wrote:
- FYI, there has also been a change in dry deposition that may be responsible for some of the observed changes: in the new version (10-01h), dry deposition of dust particles is done within the PBL mixing scheme (as for all other tracers). The former GEOS-Chem versions performed dust dry deposition within the dust chemistry routine.
Dylan Millet wrote:
- I had a look at the benchmark plots, focusing on the VOCs. There are a lot of emission updates in this version and the composition changes seem to generally be explainable by that. A few notes:
- isoprene emissions drop 30%, which is greater than the ~18% I expected based on tests when I implemented this change originally (10% decrease due to MEGAN changes + 8% decrease due to canopy change). But it's not such a difference that something is clearly wrong; may just be GEOS-FP vs GEOS-5.
- anthro + biofuel propane: > factor of 2 decrease in emissions, 12 to 5 TgC. This looks to be largely due to a massive emission decrease in Asia. Is this right? Just want to check that emissions there aren't actually zero or anything.
- CO generally shows a modest improvement compared to observations
- some VOCs change quite a bit in the inter-mountain west, I suppose this is a deliberate change in NEI-11?
- we're now using MEGAN for ALD2 (didn't previously have any biogenic emissions in the model) and PRPE, so emissions of these changed quite a bit
- there are some strange spatial patterns in the October ratio plots for some species (e.g., ALK4, MEK), oscillating between 2x increases and 2x decreases ... I'm guessing this is because we're ratioing October of 2013 with October of 2012
Prasad Kasibhatla wrote:
- I checked the emission ratio plots for biomass burning CO emissions for Jan, Apr, Jul, and Oct, as well as the annual total CO emissions from biomass burning against plots/totals that I created offline. The benchmark plots/totals match the plots/totals for CO that I generate offline. So I am confident that GFED3/4 emissions are correctly implemented in HEMCO in GC v10-01h.
- A couple of quick notes:
- The benchmark comparisons for biomass burning is not an apples-to-apples GFED3 vs GFED4 comparison because the GFED3 runs are with emissions for 2011 (because GFED3 does not go out to 2013) and the GFED4 runs are with emissions for 2013.
- The GFED4 emissions are preliminary. The final version of GFED4 will be released in a month or so. At that point, we simply have to swap out the input files read in by GC.
- One future change to the code is to be expected. GFED4 emission categories are slightly different compared to GFED3 emission categories. In the current implementation, I have mapped GFED4 dry matter burned categories into GFED3 categories offline so as to keep the emission factors the same. In the near future I expect to implement the GFED4 emission categories with updated emission factors.
Aaron van Donkelaar wrote:
- The EMEP-related emission-ratio plots look good as well. One minor point of note is that the native resolution of the updated EMEP emissions are 50 km x 50 km, not 0.1° x 0.1° grid as previously stated on the wiki. Regridding to the finer 0.1° x 0.1° resolution allowed these input files to maintain a reasonable representation of their original grid characteristics, thereby permitting HEMCO to more accurately regrid onto a variety of GEOS-Chem grids. I've updated the wiki accordingly.
Chris Holmes wrote:
- After seeing [the figures comparing v10-01i and v10-01f], I am comfortable that the PARANOX/HEMCO updates are consistent with what I expected. There is a small increase of 1-2 ppb O3 over the N. Pacific ship tracks, which are what I found in my personal benchmarks with just PARANOX changes. The changes of 10-15 ppb over the N. Atlantic appear to originate over Europe and North America (emission changes?) and overwhelm any expected effect of the PARANOX update.
Randall Martin wrote:
- Maps that Melissa just made for the 1 month benchmark are helpful to identify which inventories are responsible for which changes.
           http://ftp.as.harvard.edu/gcgrid/geos-chem/1mo_benchmarks/v10-01/v10-01h/emission_maps/
           http://ftp.as.harvard.edu/gcgrid/geos-chem/1mo_benchmarks/v10-01/v10-01h/emission_differences/
- These maps seem to indicate that the large (25%) reduction in global SO2 emissions is being driven by decreases from China. Does anyone know if this is expected? It appears somewhat surprising to me.
Yuxuan Wang wrote:
- I noticed the large reduction of SO2 over China and was surprised too. SO2 emissions from China were reported to have decreased since 2006 and I expect this decrease trend to be included in the MIX Asia inventory which is used in v10-01i. The v10-01i benchmark run is for year 2012/2013 and presumably uses yearly specific emissions for SO2. If v10-01f_UCX uses the older INTEX-B inventory for SO2 emissions which is for the year 2006 (Melissa: could you please confirm this?), then the plotted difference in SO2 emissions over China between the two versions can be explained. This is just my guess.
Melissa Sulprizio wrote:
- That is correct. The benchmarks for v10-01e and prior versions used Asian emissions from the Streets 2006 (INTEX-B) inventory, while v10-01h uses the MIX inventory. The MIX Asian emissions are available for years 2008 and 2010, so we use 2010 emissions in our benchmark simulations for v10-01h.
Qiang Zhang wrote:
- Attached is a comparison between Streets 2006 and MIX 2010 over SE Asia. SO2 emissions didn't change too much over SE Asia. Large decrease of propane emissions and increase of ethane emissions are due to update of NMVOC speciation scheme, as documented in Li et al. (2014). Anthropogenic emissions of aldehydes and ketones are also significantly increased because OVOCs are included in the new NMVOC speciation scheme.
- Daniel noticed change in far east Russia emissions. This is because of the new MIX 2010 inventory covers Asian parts of Russia and it uses different methods than EDGAR. To obtain a consistent emission estimates for Russia, I would suggest to use EDGAR for Asian Russia. We prepared a new MIX region mask file which rejected Asian Russia region.
Meng Li wrote:
- I made plots of the comparisons between MIX and INTEX-B emission inventory for SO2 for January, April, July and October (which are attached) at 4 x 5 degree, and the results are identical to those from v10-01h benchmark. So I think there are no errors in MIX emissions in simulations of benchmark v10-01h.
--Melissa Sulprizio 11:16, 6 May 2015 (EDT)
v10-01e-Run1
Three GEOS-Chem model versions were compared to each other:
| Color | Quantity Plotted | Met Type | Year | Emissions | Chemistry mechanism | Photolysis | Annual Mean OH [105 molec/cm3] |
|---|---|---|---|---|---|---|---|
| Red | v10-01c-Run0 | GEOS-FP, 47L, 4x5 |
2013 | Same as v9-02r-geosfp-Run1 | Same as v9-02r-geos5-Run0 | FAST-JX v7.0 photolysis mechanism, with the following fixes included: | 12.550 |
| Green | v10-01c-Run1 | GEOS-FP, 72L, 4x5 |
2013 | " " | UCX chemistry mechanism, includes: | " " | 11.885 |
| Blue | v10-01e-Run1 | GEOS-FP, 72L, 4x5 |
2013 | HEMCO emissions component, with the following update included: | " " | " " | 11.843 |
| Black | Observations |
The output plots for Run1 (both PostScript and PDF format) may be downloaded from:
ftp ftp.as.harvard.edu
cd gcgrid/geos-chem/1yr_benchmarks/v10-01/v10-01e/Run1/output/pdf
mget *
You may also view the PDF files online by pointing your browser to
http://ftp.as.harvard.edu/gcgrid/geos-chem/1yr_benchmarks/v10-01/v10-01e/Run1/output/pdf/
--Melissa Sulprizio 11:27, 13 April 2015 (EDT)
v10-01e-Run0
This 1-year benchmark simulation was approved by HEMCO developer Christoph Keller and the GEOS-Chem Steering Committee on 01 Dec 2014.
Three GEOS-Chem model versions were compared to each other:
| Color | Quantity Plotted | Met Type | Year | Emissions | Photolysis | Linoz | Annual Mean OH [105 molec/cm3] |
|---|---|---|---|---|---|---|---|
| Red | v9-02r-geosfp-Run1 | GEOS-FP, 47L, 4x5 |
2013 | Same as v9-02r-geos5-Run0 +Anthropogenic emissions scaled to 2010 (latest available) + 2011 GFED3 emissions (latest available) + Olson 2001 land map |
Same as v9-02r-geos5-Run0 | ON | 12.689 |
| Green | v10-01c-Run0 | GEOS-FP, 47L, 4x5 |
2013 | " " | FAST-JX v7.0 photolysis mechanism, with the following fixes included: | ON | 12.550 |
| Blue | v10-01e-Run0 | GEOS-FP, 47L, 4x5 |
2013 | HEMCO emissions component, with the following update included: | " " | ON | 12.578 |
| Black | Observations |
The output plots for Run0 (both PostScript and PDF format) may be downloaded from:
ftp ftp.as.harvard.edu
cd gcgrid/geos-chem/1yr_benchmarks/v10-01/v10-01e/Run0/output/pdf
mget *
You may also view the PDF files online by pointing your browser to
http://ftp.as.harvard.edu/gcgrid/geos-chem/1yr_benchmarks/v10-01/v10-01e/Run0/output/pdf/
--Melissa Sulprizio 11:07, 20 November 2014 (EST)
Comments about the 1-year benchmark v10-01e
Jeff Pierce wrote:
- The carbonaceous aerosols have definitely changed since the last benchmark, but now OCPI over tropical forests is less than 10% of the OCPI pre-HEMCO (page 35 of the ratios). Can you confirm that the 0.1*monoterpenes is being added to OCPI as it was pre-HEMCO?
Melissa Sulprizio responded:
- I found an error in the MEGAN emissions. In the HEMCO configuration file, we have MEGAN_SOA turned on by default because HEMCO knows to ignore the SOA species if we are not running a SOA simulation. However, with MEGAN_SOA turned on, we don’t execute the part of the code where we add 0.1*monoterpenes to OCPI. Therefore, as you noted, we see lower OCPI concentrations over tropical forests. Turning MEGAN_SOA off fixes this problem.
Shiliang Wu wrote:
- The O3 profiles show some large increases (up to 30ppb or more) in Jan for certain locations, such as Uccle(51), Hohenpeissenberg(48), Kagoshima(32), Shanghai(31), etc. - these don't look to be due to emission change, so I wonder what's causing this?
Christoph Keller wrote:
- There were two open questions regarding the 1-yr benchmark (at least to my knowledge):
- 1. The ozone ‘blob’ forming over Europe in January
- 2. The much lower concentration of NITs and SO4s in v10-01e compared to v10-01c.
- I think I have an explanation for both points, and I would argue that the new code makes more sense physically:
- 1. The ozone blob is actually a good thing as it removes an issue that was introduced in v9-02r. As Melissa pointed out to me, ever since v9-02r we have been seeing a drastic decrease of ozone over Europe (and to a lesser extent East Asia) in January. This was because PARANOX could produce - under low O3 conditions - incredibly high O3 deposition values (division of a high number by a very, very small number). This would basically create a black hole for ozone at the surface that would then remove more and more ozone from the entire column. Melissa did a number of sensitivity studies where she ran v10-01c with and without PARANOX, and those plots show this effect very nicely. The new code does not allow such a behavior anymore, which explains the higher ozone concentrations in January compared to v10-01e.
- 2. NITs and SO4s are closely linked to sulfate chemistry and thus alkalinity. Alkalinity is directly obtained from the total mass of emitted sea salt aerosol, e.g. we approximate alkalinity = SSA. Since SSA is a 2D field but alkalinity is 3D, the sea salt aerosol need to be distributed vertically. In the old code, alkalinity was set to the total mass of emitted sea salt aerosol for every grid box that was below the PBL (zero otherwise). In other words, if the PBL was at level 11, the integrated alkalinity over this column was 10 times higher than the total mass of emitted sea salt aerosols in the same column. I found that not very realistic and therefore changed the alkalinity calculation so that it takes into account the fraction of the PBL. I also checked in with Fabien Paulot who has been working on this and he also thinks that this is the better way of doing it. After all, it ensures that the total alkalinity equals the total amount of emitted sea salt aerosols. This explains the much lower values for NITs and SO4s that we see in v10-01e compared to v10-01c.
--Melissa Sulprizio 11:33, 1 December 2014 (EST)
v10-01c-Run1
This 1-year benchmark simulation was approved by the GEOS-Chem Steering Committee on 26 Jun 2014.
Three GEOS-Chem model versions were compared to each other:
| Color | Quantity Plotted | Met Type | Year | Chemistry mechanism | Photolysis | Linoz | Annual Mean OH [105 molec/cm3] |
|---|---|---|---|---|---|---|---|
| Red | v9-02r-geosfp-Run1 | GEOS-FP, 47L, 4x5 |
2013 | Same as v9-02r-geos5-Run0 | Same as v9-02r-geos5-Run0 | ON | 12.689 |
| Green | v10-01c-Run0 | GEOS-FP, 47L, 4x5 |
2013 | " " | FAST-JX v7.0 photolysis mechanism, with the following fixes included: | ON | 12.550 |
| Blue | v10-01c-Run1 | GEOS-FP, 72L, 4x5 |
2013 | UCX chemistry mechanism, includes: | " " | ON | 11.885 |
| Black | Observations |
The output plots for Run1 (both PostScript and PDF format) may be downloaded from:
ftp ftp.as.harvard.edu
cd gcgrid/geos-chem/1yr_benchmarks/v10-01/v10-01c/Run1/output/ps
mget *
cd gcgrid/geos-chem/1yr_benchmarks/v10-01/v10-01c/Run1/output/pdf
mget *
You may also view the PDF files online by pointing your browser to
http://ftp.as.harvard.edu/gcgrid/geos-chem/1yr_benchmarks/v10-01/v10-01c/Run1/output/pdf/
--Melissa Sulprizio 16:54, 23 June 2014 (EDT)
v10-01c-Run0
This 1-year benchmark simulation was approved by the GEOS-Chem Steering Committee on 26 Jun 2014.
Three GEOS-Chem model versions were compared to each other:
| Color | Quantity Plotted | Met Type | Year | Emissions | Photolysis | Linoz | Annual Mean OH [105 molec/cm3] |
|---|---|---|---|---|---|---|---|
| Red | v9-02r-geosfp-Run0 | GEOS-FP, 47L, 4x5 |
2013 | Same as v9-02r-geos5-Run0 (scaled all emissions to 2005) |
Same as v9-02r-geos5-Run0 | ON | 12.389 |
| Green | v9-02r-geosfp-Run1 | GEOS-FP, 47L, 4x5 |
2013 | Anthropogenic emissions scaled to 2010 (latest available) + 2011 GFED3 emissions (latest available) + Olson 2001 land map |
" " | ON | 12.689 |
| Blue | v10-01c-Run0 | GEOS-FP, 47L, 4x5 |
2013 | " " | FAST-JX v7.0 photolysis mechanism, with the following fixes included: | ON | 12.550 |
| Black | Observations |
The output plots for Run0 (both PostScript and PDF format) may be downloaded from:
ftp ftp.as.harvard.edu
cd gcgrid/geos-chem/1yr_benchmarks/v10-01/v10-01c/Run0/output/ps
mget *
cd gcgrid/geos-chem/1yr_benchmarks/v10-01/v10-01c/Run0/output/pdf
mget *
You may also view the PDF files online by pointing your browser to
http://ftp.as.harvard.edu/gcgrid/geos-chem/1yr_benchmarks/v10-01/v10-01c/Run0/output/pdf/
--Melissa Sulprizio 14:56, 10 June 2014 (EDT)
1-month benchmarks
v10-01-public-release
We performed two 1-month benchmark simulations for v10-01i-public-release:
- v10-01-public-release: 1-month benchmark with SOA turned off
- v10-01-public-release: 1-month benchmark with SOA turned on
1-month benchmark v10-01-public-release with SOA on
Here is the assessment form for 1-month benchmark simulation v10-01-public-release with SOA turned on (aka v10-01-public-release-Run1).
| Description | |
|---|---|
| New features added into GEOS-Chem: |
Features affecting the full-chemistry simulation in this benchmark:
Features not affecting the full-chemistry simulation in this benchmark:
|
| Developer name(s) and institution(s): |
|
| Version, resolution, met fields used: | v10-01, GEOS-FP (72L), 4x5, July 2013 |
| 1-month benchmark finished on: | Fri Jun 12 02:09:11 EDT 2015 |
| Performance statistics: |
|
| Compared to previous benchmark: | v10-01-public-release-Run0 |
| This update will impact: (select all that apply with boldface) |
Advection, BL Mixing, Convection, Met Fields, Dry Dep, Wet Dep, Stratosphere, Anthro Emiss, Biogenic Emiss, Biomass Emiss, Photolysis, Chemistry, Other (please specify): |
| Unit test results may be viewed at: | TBD
NOTE: Unit tests for tagged CO and TOMAS were not performed, since these simulations are not yet 100% compatible with HEMCO. |
| Plots may be viewed at: | http://ftp.as.harvard.edu/gcgrid/geos-chem/1mo_benchmarks/v10-01/v10-01i-public-release/ |
| Metrics | |
| Global mean OH (from log file): | 12.5830401169557 x 10⁵ molec/cm3 |
| Methyl chloroform lifetime: | 4.9906 years |
| Did either of these change by more than 5%? | No. The mean OH differs by -0.66%, and the MCF lifetime differs by 0.78%. |
| At the SURFACE, list all species that changed by 10% or more: | |
| Comments on SURFACE differences: |
|
| At 500 hPa, list all species that changed by 10% or more: | |
| Comments on 500 hPa differences: |
|
| In the ZONAL MEAN differences, list all species that changed by 10% or more: | |
| Comments on ZONAL MEAN differences: |
|
| In the EMISSION RATIO maps, list all species that changed by 10% or more: | |
| Comments on EMISSION RATIO differences: | |
| Additional or summary comments: | |
| Approval | |
| Requires further investigation: | |
| Approved by: | TBD |
| Date of approval: | TBD |
--Melissa Sulprizio (talk) 15:12, 12 June 2015 (UTC)
1-month benchmark v10-01-public-release with SOA off
Here is the assessment form for 1-month benchmark simulation v10-01-public-release with SOA turned off (aka v10-01-public-release-Run0).
| Description | |
|---|---|
| New features added into GEOS-Chem: |
Features affecting the full-chemistry simulation in this benchmark:
Features not affecting the full-chemistry simulation in this benchmark:
|
| Developer name(s) and institution(s): |
|
| Version, resolution, met fields used: | v10-01, GEOS-FP (72L), 4x5, July 2013 |
| 1-month benchmark finished on: | Thu Jun 11 18:14:08 EDT 2015 |
| Performance statistics: |
|
| Compared to previous benchmark: | v10-01i |
| This update will impact: (select all that apply with boldface) |
Advection, BL Mixing, Convection, Met Fields, Dry Dep, Wet Dep, Stratosphere, Anthro Emiss, Biogenic Emiss, Biomass Emiss, Photolysis, Chemistry, Other (please specify): |
| Unit test results may be viewed at: | TBD
NOTE: Unit tests for tagged CO and TOMAS were not performed, since these simulations are not yet 100% compatible with HEMCO. |
| Plots may be viewed at: | http://ftp.as.harvard.edu/gcgrid/geos-chem/1mo_benchmarks/v10-01/v10-01i-public-release/ |
| Metrics | |
| Global mean OH (from log file): | 12.6672178312186 x 10⁵ molec/cm3 |
| Methyl chloroform lifetime: | 4.9517 years |
| Did either of these change by more than 5%? | No. The mean OH differs by 0.80%, and the MCF lifetime differs by -0.35%. |
| At the SURFACE, list all species that changed by 10% or more: | |
| Comments on SURFACE differences: |
|
| At 500 hPa, list all species that changed by 10% or more: | |
| Comments on 500 hPa differences: |
|
| In the ZONAL MEAN differences, list all species that changed by 10% or more: | |
| Comments on ZONAL MEAN differences: |
|
| In the EMISSION RATIO maps, list all species that changed by 10% or more: | |
| Comments on EMISSION RATIO differences: | |
| Additional or summary comments: | |
| Approval | |
| Requires further investigation: | |
| Approved by: | TBD |
| Date of approval: | TBD |
--Melissa Sulprizio (talk) 15:12, 12 June 2015 (UTC)
v10-01i
We performed two 1-month benchmark simulations for v10-01i:
- v10-01i: 1-month benchmark with RRTMG turned off
- v10-01i_RRTMG: 1-month benchmark with RRTMG turned on
1-month benchmark v10-01i with RRTMG off
Here is the assessment form for 1-month benchmark simulation v10-01i with RRTMG turned off (aka v10-01i).
| Description | |
|---|---|
| New features added into GEOS-Chem: |
Features affecting the full-chemistry simulation in this benchmark:
Features not affecting the full-chemistry simulation in this benchmark:
|
| Developer name(s) and institution(s): |
|
| Version, resolution, met fields used: | v10-01, GEOS-FP (72L), 4x5, July 2013 |
| 1-month benchmark finished on: | Thu Apr 23 04:30:25 EDT 2015 |
| Performance statistics: |
|
| Compared to previous benchmark: | v10-01h |
| This update will impact: (select all that apply with boldface) |
Advection, BL Mixing, Convection, Met Fields, Dry Dep, Wet Dep, Stratosphere, Anthro Emiss, Biogenic Emiss, Biomass Emiss, Photolysis, Chemistry, Other (please specify): |
| Unit test results may be viewed at: | http://ftp.as.harvard.edu/gcgrid/geos-chem/1mo_benchmarks/v10-01/v10-01i/v10-01i.results.html
NOTE: Unit tests for tagged CO and TOMAS were not performed, since these simulations are not yet 100% compatible with HEMCO. |
| Plots may be viewed at: | http://ftp.as.harvard.edu/gcgrid/geos-chem/1mo_benchmarks/v10-01/v10-01i/ |
| Metrics | |
| Global mean OH (from log file): | 12.5663562879762 x 10⁵ molec/cm3 |
| Methyl chloroform lifetime: | 4.9693 years |
| Did either of these change by more than 5%? | No. The mean OH differs by -1.25%, and the MCF lifetime differs by -1.73%. |
| At the SURFACE, list all species that changed by 10% or more: | NO, O3, PAN, ALK4, ISOP, HNO3, H2O2, ACET, MEK, ALD2, MVK, MACR, PMN, PPN, R4N2, PRPE, C3H8, CH2O, C2H6, N2O5, HNO4, MP, DMS, SO2, SO4, SO4s, MSA, NH3, HH4, NIT, NITs, BCPI, BCPO, OCPI, BCPO, DST4, Br2, Br, BrO, HOBr, HBr, BrNO2, BrNO3, MPN, ISOPN, MOBA, HAC, GLYC, MMN, RIP, IEPOX, MAP, NO2, NO3, HNO2, BrCl, HCl, Cl, ClO, HOCl, ClNO3, ClNO2, ClOO, OClO, Cl2, Cl2O2, OH |
| Comments on SURFACE differences: |
|
| At 500 hPa, list all species that changed by 10% or more: | NO, ALK4, HNO3, H2O2, MEK, MVK, MACR, PMN, R4N2, PRPE, C3H8, CH2O, N2O5, HNO4, MP, DMS, SO2, SO4, SO4s, MSA, NH3, NH4, NIT, NITs, Br2, Br, BrO, HOBr, HBr, BrNO2, BrNO3, MPN, ISOPN, MOBA, HAC, GLYC, MMN, RIP, IEPOX, MAP, NO2, NO3, HNO2, BrCl, HCl, Cl, ClO, HOCl, ClNO3, ClNO2 (minor changes), ClOO, OClO, Cl2, Cl2O2, OH |
| Comments on 500 hPa differences: | See comments for SURFACE DIFFERENCES above. |
| In the ZONAL MEAN differences, list all species that changed by 10% or more: | NO, O3, PAN, HNO3, H2O2, MEK, ALD2, RCHO, MVK, MACR, PMN, PPN, R4N2, PRPE, C3H8, CH2O, N2O5, HNO4, MP, DMS, SO2, SO4, SO4s, MSA, NH3, NH4, NIT, NITs, BCPI, BCPO, OCPO, DST2, Br2, Br, BrO, HOBr, HBr, BrNO2, BrNO3, MPN, HAC, GLYC, MMN, RIP, IEPOX, MAP, NO2, NO3, HNO2, BrCl, CH3CCl3, CFC11, H1211, H24O2, Cl, ClO, HOCl, ClNO3, ClNO2, ClOO, OClO, Cl2, Cl2O2, |
| Comments on ZONAL MEAN differences: |
|
| In the EMISSION RATIO maps, list all species that changed by 10% or more: | ACET, ALD2, ALK4, C2H6, C3H8, CO, ISOP, NH3, NO, SO2, SO4 |
| Comments on EMISSION RATIO differences: |
|
| Additional or summary comments: |
|
| Approval | |
| Requires further investigation: | No |
| Approved by: | Daniel Jacob |
| Date of approval: | 30 Apr 2015 |
--Bob Y. 16:37, 30 April 2015 (EDT)
1-month benchmark v10-01i with RRTMG on
Here is the assessment form for 1-month benchmark simulation v10-01i with RRTMG turned on (aka v10-01I_RRTMG).
| Description | |
|---|---|
| New features added into GEOS-Chem: |
Features affecting the full-chemistry simulation in this benchmark:
Features not affecting the full-chemistry simulation in this benchmark:
|
| Developer name(s) and institution(s): |
|
| Version, resolution, met fields used: | v10-01, GEOS-FP (72L), 4x5, July 2013 |
| 1-month benchmark finished on: | Mon Apr 27 11:48:13 EDT 2015 |
| Performance statistics: |
|
| Compared to previous benchmark: | v10-01i |
| This update will impact: (select all that apply with boldface) |
Advection, BL Mixing, Convection, Met Fields, Dry Dep, Wet Dep, Stratosphere, Anthro Emiss, Biogenic Emiss, Biomass Emiss, Photolysis, Chemistry, Other (please specify): |
| Unit test results may be viewed at: | http://ftp.as.harvard.edu/gcgrid/geos-chem/1mo_benchmarks/v10-01/v10-01i/v10-01i.results.html
NOTE: Unit tests for tagged CO and TOMAS were not performed, since these simulations are not yet 100% compatible with HEMCO. |
| Plots may be viewed at: | http://ftp.as.harvard.edu/gcgrid/geos-chem/1mo_benchmarks/v10-01/v10-01i_RRTMG/ |
| Metrics | |
| Global mean OH (from log file): | 12.5663562879762 x 10⁵ molec/cm3 |
| Methyl chloroform lifetime: | 4.9693 years |
| Did either of these change by more than 5%? | No. The mean OH and MCF lifetimes are unchanged from 1-month benchmark v10-01i. |
| At the SURFACE, list all species that changed by 10% or more: | None |
| Comments on SURFACE differences: |
|
| At 500 hPa, list all species that changed by 10% or more: | None |
| Comments on 500 hPa differences: |
|
| In the ZONAL MEAN differences, list all species that changed by 10% or more: | None |
| Comments on ZONAL MEAN differences: |
|
| In the EMISSION RATIO maps, list all species that changed by 10% or more: | None |
| Comments on EMISSION RATIO differences: | |
| Additional or summary comments: |
Bob Yantosca wrote:
Dave Ridley wrote:
|
| Approval | |
| Requires further investigation: | Some minor issues will be sorted out during the public comment period. |
| Approved by: | David Ridley, Colette Heald |
| Date of approval: | 01 May 2015 |
--Melissa Sulprizio 10:53, 28 April 2015 (EDT)
--Bob Y. 15:56, 1 May 2015 (EDT)
v10-01h
Here is the assessment form for 1-month benchmark simulation v10-01h
| Description | |
|---|---|
| New features added into GEOS-Chem: |
Features affecting the full-chemistry simulation in this benchmark:
Features not affecting the full-chemistry simulation in this benchmark:
|
| Developer name(s) and institution(s): |
|
| Version, resolution, met fields used: | v10-01, GEOS-FP (72L), 4x5, July 2013 |
| 1-month benchmark finished on: | Thu Mar 26 21:09:41 EDT 2015 |
| Performance statistics: |
|
| Compared to previous benchmark: | v10-01f_UCX |
| This update will impact: (select all that apply with boldface) |
Advection, BL Mixing, Convection, Met Fields, Dry Dep, Wet Dep, Stratosphere, Anthro Emiss, Biogenic Emiss, Biomass Emiss, Photolysis, Chemistry, Other (please specify): |
| Unit test results may be viewed at: | http://ftp.as.harvard.edu/gcgrid/geos-chem/1mo_benchmarks/v10-01/v10-01h/v10-01h.results.html
NOTE: Unit tests for tagged CO and TOMAS were not performed, since these simulations are not yet 100% compatible with HEMCO. |
| Plots may be viewed at: | http://ftp.as.harvard.edu/gcgrid/geos-chem/1mo_benchmarks/v10-01/v10-01h/ |
| Metrics | |
| Global mean OH (from log file): | 12.4116120372531 x 10⁵ molec/cm3 |
| Methyl chloroform lifetime: | 5.0567 years |
| Did either of these change by more than 5%? | No. The mean OH differs by -1.04%, and the MCF lifetime differs by 2.01%. |
| At the SURFACE, list all species that changed by 10% or more: | NO, O3, PAN, CO, ALK4, ISOP, HNO3, H2O2, ACET, MEK, ALD2, RCHO, MVK, MACR, PMN, PPN, R4N2, PRPE, C3H8, CH2O, C2H6, N2O5, HNO4, MP, DMS, SO2, SO4, SO4s, MSA, NH3, NH4, NIT, NITs, BCPI, OCPI, BCPO, OCPO, DST4, Br2, Br, BrO, HOBr, HBr, BrNO2, BrNO3, MPN, ISOPN, MOBA, PROPNN, HAC, GLYC, MMN, RIP, IEPOX, MAP, NO2, NO3, HNO2, BrCl, HCl, Cl, ClO, HOCl, ClNO3, ClNO2, ClOO, OClO, Cl2, Cl2O2, OH, HO2 |
| Comments on SURFACE differences: |
|
| At 500 hPa, list all species that changed by 10% or more: | NO, O3, PAN, CO, ALK4, ISOP, HNO3, H2O2, ACET, MEK, ALD2, RCHO, MVK, MACR, PMN, PPN, R4N2, PRPE, C3H8, CH2O, C2H6, N2O5, HNO4, MP, DMS, SO2, SO4, SO4s, MSA, NH3, NH4, NIT, NITs, BCPI, OCPI, BCPO, OCPO, DST4, Br2, Br, BrO, HOBr, HBr, BrNO2, BrNO3, MPN, ISOPN, MOBA, PROPNN, HAC, GLYC, MMN, RIP, IEPOX, MAP, NO2, NO3, HNO2, BrCl, Cl, ClO, HOCl, ClNO3, ClNO2, ClOO, OClO, Cl2, Cl2O2, OH, HO2 |
| Comments on 500 hPa differences: |
|
| In the ZONAL MEAN differences, list all species that changed by 10% or more: | NO, O3, PAN, CO, ALK4, ISOP, HNO3, H2O2, ACET, MEK, ALD2, RCHO, MVK, MACR, PMN, PPN, R4N2, PRPE, C3H8, CH2O, C2H6, N2O5, HNO4, MP, DMS, SO2, SO4, SO4s, MSA, NH3, NH4, NIT, NITs, BCPI, OCPI, BCPO, OCPO, DST1, DST2, DST3, DST4, SALC, Br2, Br, BrO, HOBr, HBr, BrNO2, BrNO3, MPN, ISOPN, MOBA, PROPNN, HAC, GLYC, MMN, RIP, IEPOX, MAP, NO2, NO3, HNO2, OCS, BrCl, HCl, Cl4, CH3CCl3, H1211, H1301, H2402, Cl, ClO, HOCl, ClNO3, ClNO2, ClOO, OClO, Cl2, Cl2O2, OH, HO2 |
| Comments on ZONAL MEAN differences: |
|
| In the EMISSION RATIO maps, list all species that changed by 10% or more: |
|
| Comments on EMISSION RATIO differences: |
|
| Additional or summary comments: | General comments:
Also note the following discussions pertaining to various emissions now handled by HEMCO:
|
| Approval | |
| Requires further investigation: | |
| Approved by: | |
| Date of approval: |
--Bob Y. 12:39, 27 March 2015 (EDT)
v10-01g
We did not run a 1-month benchmark simulation for v10-01g. This version consisted entirely of bug fixes and structural updates. We will validate these updates in the 1-month benchmark v10-01h, along with several HEMCO emissions updates.
--Melissa Sulprizio 18:04, 25 February 2015 (EST)
v10-01f
We performed two 1-month benchmark simulations for v10-01f:
- v10-01f_trop: 1-month benchmark with tropopsheric chemistry
- v10-01f_UCX: 1-month benchmark with UCX strat-trop chemistry (72 vertical levels)
1-month benchmark v10-01f with UCX chemistry
Here is the assessment form for 1-month benchmark simulation v10-01f with UCX chemistry (aka v10-01f_UCX).
| Description | |
|---|---|
| New features added into GEOS-Chem: |
Features affecting the full-chemistry simulation in this benchmark:
Features not affecting the full-chemistry simulation in this benchmark: |
| Developer name(s) and institution(s): |
|
| Version, resolution, met fields used: | v10-01, GEOS-FP (72L), 4x5, July 2013 |
| 1-month benchmark finished on: | Thu Jan 8 20:26:53 EST 2015 |
| Performance statistics: |
|
| Compared to previous benchmark: | v10-01e_UCX |
| This update will impact: (select all that apply with boldface) |
Advection, BL Mixing, Convection, Met Fields, Dry Dep, Wet Dep, Stratosphere, Anthro Emiss, Biogenic Emiss, Biomass Emiss, Photolysis, Chemistry, Other (please specify): |
| Unit test results may be viewed at: | ftp://ftp.as.harvard.edu/gcgrid/geos-chem/1mo_benchmarks/v10-01/v10-01f/v10-01f_trop/v10-01f_trop.results.html
NOTE: Unit tests for tagged CO and TOMAS were not performed, since these simulations are not yet 100% compatible with HEMCO. |
| Plots may be viewed at: | ftp://ftp.as.harvard.edu/gcgrid/geos-chem/1mo_benchmarks/v10-01/v10-01f/v10-01f_UCX/ |
| Metrics | |
| Global mean OH (from log file): | 12.5428873166735 x 10⁵ molec/cm3 |
| Methyl chloroform lifetime: | 4.9566 years |
| Did either of these change by more than 5%? | No. The mean OH differs by -3.40%, and the MCF lifetime differs by 3.58%. |
| At the SURFACE, list all species that changed by 10% or more: | NO (S. pole), ALK4, ISOP (at poles and over oceans), HNO3 (paranox bug), MEK, MVK, MACR, PMN, PRPE, N2O5, HNO4, DMS, SO4S and NITS (HEMCO bug), Br2, BrO, BrNO3, MPN, ISOPN, MOBA,, GLYC, MMN, RIP, IEPOX, NO2, NO3, BrCl, Cl, ClO, HOCl, ClNO3, ClNO2, ClOO, OClO, Cl2, Cl2O2, OH |
| Comments on SURFACE differences: |
|
| At 500 hPa, list all species that changed by 10% or more: | NO, ALK4, ISOP, HNO3, MEK, MVK, MACR, PMN, PRPE, N2O5, HNO4, DMS, SO4s and NITs (HEMCO bug), NH3, NIT, OCPI, OCPO, DST4, Br2, Br, BrO, HBr, BRNO2, BrNO3, MPN, ISOPN, MOBA, HAC, GLYC, MMN, RIP, IEPOX, NO2, NO3, HNO2, BrCl, Cl, ClO, HOCl, ClNO3, ClNO2, ClOO, OClO, Cl2, Cl2O2, OH, HO2 |
| Comments on 500 hPa differences: |
|
| In the ZONAL MEAN differences, list all species that changed by 10% or more: | NO, O3, PAN (near tropopause), PRPE, N2O5 (near trop), HNO4, MP, DMS, OCPI, CH4, H2O (in strat), OH, HO2, ISOP, ISOPN, MOBA, HAC, GLYC, MMN, RIP, MAP, IEPOX, ALK4, ACET (near top of atm), MEK, ALD2, RCHO, MVK, MACR, PMN, R4N2, PRPE, C3H8, CH2O, DMS, SO4s, NH3, NIT, NITs, BCPO, OCPO, DST2, DST3, DST4, SALC, MPN, NO2, NO3, HNO2, N2O, Br2, Br, BrO, HOBr, HBr, BrNO2, BrNO3, CHBr3, CH2Br2, CH3Br, BrCl, HCl, H1211, ClO, HOCl, ClNO3, ClNO2, ClOO, OClO, Cl2, Cl2O2. |
| Comments on ZONAL MEAN differences: |
|
| In the EMISSION RATIO maps, list all species that changed by 10% or more: | NO (anthro+biofuel), SO2 (anthro+biofuel), SO4 (anthro+biofuel) |
| Comments on EMISSION RATIO differences: |
|
| Additional or summary comments: |
|
| Approval | |
| Requires further investigation: | No |
| Approved by: | Bob Y. |
| Date of approval: | 09 Jan 2015 |
--Melissa Sulprizio 17:38, 6 January 2015 (EST)
1-month benchmark v10-01f with tropospheric chemistry
Here is the assessment form for 1-month benchmark simulation v10-01f with tropospheric chemistry (aka v10-01f_trop).
| Description | |
|---|---|
| New features added into GEOS-Chem: |
Features affecting the full-chemistry simulation in this benchmark:
Features not affecting the full-chemistry simulation in this benchmark:
|
| Developer name(s) and institution(s): |
|
| Version, resolution, met fields used: | v10-01, GEOS-FP (47L), 4x5, July 2013 |
| 1-month benchmark finished on: | Wed Jan 7 14:59:29 EST 2015 |
| Performance statistics: |
|
| Compared to previous benchmark: | v10-01e_trop |
| This update will impact: (select all that apply with boldface) |
Advection, BL Mixing, Convection, Met Fields, Dry Dep, Wet Dep, Stratosphere, Anthro Emiss, Biogenic Emiss, Biomass Emiss, Photolysis, Chemistry, Other (please specify): |
| Unit test results may be viewed at: | ftp://ftp.as.harvard.edu/gcgrid/geos-chem/1mo_benchmarks/v10-01/v10-01f/v10-01f_trop/v10-01f_trop.results.html
NOTE: Unit tests for tagged CO and TOMAS were not performed, since these simulations are not yet 100% compatible with HEMCO. |
| Plots may be viewed at: | ftp://ftp.as.harvard.edu/gcgrid/geos-chem/1mo_benchmarks/v10-01/v10-01f/v10-01f_trop/ |
| Metrics | |
| Global mean OH (from log file): | 13.5245943486961 x 10⁵ molec/cm3 |
| Methyl chloroform lifetime: | 4.7552 years |
| Did either of these change by more than 5%? | No. The mean OH differs by -0.15%, and the MCF lifetime differs by -0.14%. |
| At the SURFACE, list all species that changed by 10% or more: | NO, ISOP, HNO3, MVK, MACR, PMN, SO2, SO4s, NH4, NIT, OCPI, OCPO, DST4, ISOPN, RIP, NH3, HNO3 |
| Comments on SURFACE differences: |
|
| At 500 hPa, list all species that changed by 10% or more: | NO, SO4s, NIT, NITs, OCPI, OCPO, DST4, ISOPN, RIP |
| Comments on 500 hPa differences: |
|
| In the ZONAL MEAN differences, list all species that changed by 10% or more: | NO, ISOP, MVK, MACR, PMN, C3H8, SO2, SO4s, NH3, NIT, NITs, OCPO, DST4, ISOPN, MAP, Br, Br2, BrNO3, NH3 |
| Comments on ZONAL MEAN differences: |
|
| In the EMISSION RATIO maps, list all species that changed by 10% or more: | NO (anthro+biofuel), SO2 (anthro+biofuel), SO4 (anthro+biofuel) |
| Comments on EMISSION RATIO differences: |
|
| Additional or summary comments: |
|
| Approval | |
| Requires further investigation: | No |
| Approved by: | Bob Y. |
| Date of approval: | 08 Jan 2015 |
--Melissa Sulprizio 17:38, 6 January 2015 (EST) and
--Bob Y. 14:42, 8 January 2015 (EST)
v10-01e
We performed two 1-month benchmark simulations for v10-01e:
- v10-01e_trop: 1-month benchmark with tropopsheric chemistry
- v10-01e_UCX: 1-month benchmark with UCX strat-trop chemistry (72 vertical levels)
1-month benchmark v10-01e with UCX chemistry
Here is the assessment form for 1-month benchmark simulation v10-01e with UCX chemistry (aka v10-01e_UCX).
| Description | |
|---|---|
| New features added into GEOS-Chem: |
Features affecting the full-chemistry simulation in this benchmark: Features not affecting the full-chemistry simulation in this benchmark: |
| Developer name(s) and institution(s): |
|
| Version, resolution, met fields used: | v10-01, GEOS-FP (72L), 4x5, July 2013 |
| 1-month benchmark finished on: | Thu Nov 6 00:26:55 EST 2014 |
| Performance statistics: |
|
| Compared to previous benchmark: | v10-01d_UCX |
| This update will impact: (select all that apply with boldface) |
Advection, BL Mixing, Convection, Met Fields, Dry Dep, Wet Dep, Stratosphere, Anthro Emiss, Biogenic Emiss, Biomass Emiss, Photolysis, Chemistry, Other (please specify): |
| Unit test results may be viewed at: | ftp://ftp.as.harvard.edu/gcgrid/geos-chem/1mo_benchmarks/v10-01/v10-01e/v10-01e_UCX/v10-01e.results.html
NOTE: Unit tests for tagged CO and TOMAS were not performed, since these simulations are not yet 100% compatible with HEMCO. |
| Plots may be viewed at: | ftp://ftp.as.harvard.edu/gcgrid/geos-chem/1mo_benchmarks/v10-01/v10-01e/v10-01e_UCX/ |
| Metrics | |
| Global mean OH (from log file): | 12.9849685422903 x 10⁵ molec/cm3 |
| Methyl chloroform lifetime: | 4.7803 years |
| Did either of these change by more than 5%? | No. The mean OH differs by -0.74%, and the MCF lifetime differs by 0.49%. |
| At the SURFACE, list all species that changed by 10% or more: | NO, PAN, ALK4, ISOP, HNO3, H2O2, ACET, MEK, ALD2, RCHO, MVK, MACR, PMN, PPN, R4N2, PRPE, C3H8, CH2O, C2H6, N2O5, HNO4, MP, DMS, SO2, SO4, SO4s, MSA, NH3, NH4, NIT, NITs, OCPI, OCPO, DST4, Br2, Br, BrO, HOBr, HBr, BrNO2, BrNO3, MPN, ISOPN, MOBA, PROPNN, HAC, GLYC, MMN, RIP, IEPOX, MAP, NO2, NO3, HNO2, BrCl, Cl, ClO, HOCl, ClNO3, ClNO2, ClOO, OClO, Cl2, Cl2O2, OH, HO2 |
| Comments on SURFACE differences: |
|
| At 500 hPa, list all species that changed by 10% or more: | NO, PAN, ALK4, ISOP, HNO3, H2O2, MEK, ALD2, RCHO, MVK, MACR, PMN, R4N2, PRPE, C2H6, N2O5, HNO4, DMS, SO2, SO4, SO4s, MSA, NH3, NH4, NIT, NITs, OCPI, OCPO, DST4, Br2, Br, BrO, HOBr, HBr, BrNO2, BrNO3, ISOPN, MOBA, PROPNN, HAC, GLYC, MMN, RIP, IEPOX, MAP, NO2, NO3, HNO2, BrCl, Cl, ClNO2, OClO, Cl2, Cl2O2 |
| Comments on 500 hPa differences: |
|
| In the ZONAL MEAN differences, list all species that changed by 10% or more: | NO, PAN, ALK4, ISOP, HNO3, MEK, ALD2, RCHO, MVK, MACR, PMN, PPN, PRPE, C3H8, C2H6, N2O5, HNO4, MP, DMS, SO2, SO4, SO4s, MSA, NH3, NH4, NIT, NITs, OCPI, BCPO, OCPO, DST1, DST2, DST3, SALC, Br2, Br, BrO, HOBr, HBr, BrNO2, BrNO3, ISOPN, MOBA, PROPNN, HAC, GLYC, MMN, RIP, IEPOX, MAP, NO2, NO3, HNO2, OCS, BrCl, CCl4, CH3CCl3, CFC11, H1211, H1301, H2402, Cl, HOCl, ClNO3, ClNO2, ClOO, OClO, Cl2, Cl2O2, OH |
| Comments on ZONAL MEAN differences: |
|
| In the EMISSION RATIO maps, list all species that changed by 10% or more: |
|
| Comments on EMISSION RATIO differences: |
|
| Additional or summary comments: |
|
| Approval | |
| Requires further investigation: | No |
| Approved by: | Bob Y. and Christoph Keller |
| Date of approval: | 06 Nov 2014 |
--Melissa Sulprizio 06:29, 6 November 2014 (EST)
--Bob Y. 10:24, 6 November 2014 (EST)
1-month benchmark v10-01e with tropospheric chemistry
Here is the assessment form for 1-month benchmark simulation v10-01e with tropospheric chemistry (aka v10-01e_trop).
| Description | |
|---|---|
| New features added into GEOS-Chem: |
Features affecting the full-chemistry simulation in this benchmark: Features not affecting the full-chemistry simulation in this benchmark: |
| Developer name(s) and institution(s): |
|
| Version, resolution, met fields used: | v10-01, GEOS-FP (47L), 4x5, July 2013 |
| 1-month benchmark finished on: | Wed Nov 5 18:31:03 EST 2014 |
| Performance statistics: |
|
| Compared to previous benchmark: | v10-01d_trop |
| This update will impact: (select all that apply with boldface) |
Advection, BL Mixing, Convection, Met Fields, Dry Dep, Wet Dep, Stratosphere, Anthro Emiss, Biogenic Emiss, Biomass Emiss, Photolysis, Chemistry, Other (please specify): |
| Unit test results may be viewed at: | ftp://ftp.as.harvard.edu/gcgrid/geos-chem/1mo_benchmarks/v10-01/v10-01e/v10-01e_trop/v10-01e.results.html
NOTE: Unit tests for tagged CO and TOMAS were not performed, since these simulations are not yet 100% compatible with HEMCO. |
| Plots may be viewed at: | ftp://ftp.as.harvard.edu/gcgrid/geos-chem/1mo_benchmarks/v10-01/v10-01e/v10-01e_trop/ |
| Metrics | |
| Global mean OH (from log file): | 13.5883620833673 x 10⁵ molec/cm3 |
| Methyl chloroform lifetime: | 4.7619 years |
| Did either of these change by more than 5%? | No. The mean OH differs by -0.62%, and the MCF lifetime differs by 0.22%. |
| At the SURFACE, list all species that changed by 10% or more: | NO, PAN, ALK4, ISOP, HNO3, H2O2, ACET, MEK, ALD2, RCHO, MVK, MACR, PMN, PPN, R4N2, PRPE, C3H8, CH2O, C2H6, N2O5, HNO4, MP, DMS, SO2, SO4, SO4s, MSA, NH3, NH4, NIT, NITs, OCPI, OCPO, DST4, Br2, Br, BrO, HOBr, HBr, BrNO2, BrNO3, MPN, ISOPN, MOBA, PROPNN, HAC, GLYC, MMN, RIP, IEPOX, MAP, NO2, NO3, HNO2, OH, HO2 |
| Comments on SURFACE differences: |
|
| At 500 hPa, list all species that changed by 10% or more: | NO, PAN, ALK4, ISOP, HNO3, H2O2, MEK, ALD2, RCHO, MVK, MACR, PMN, R4N2, PRPE, C2H6, N2O5, HNO4, DMS, SO2, SO4, SO4s, MSA, NH3, NH4, NIT, NITs, OCPI, OCPO, DST4, Br2, Br, BrO, HOBr, HBr, BrNO2, BrNO3, ISOPN, MOBA, PROPNN, HAC, GLYC, MMN, RIP, IEPOX, MAP, NO2, NO3, HNO2 |
| Comments on 500 hPa differences: |
|
| In the ZONAL MEAN differences, list all species that changed by 10% or more: | NO, PAN, ALK4, ISOP, HNO3, MEK, ALD2, RCHO, MVK, MACR, PMN, PPN, PRPE, C3H8, CH2O, C2H6, N2O5, HNO4, DMS, SO2, SO4, SO4s, MSA, NH3, NH4, NIT, NITs, OCPI, BCPO, OCPO, DST3, SALC, Br2, Br, BrO, HOBr, HBr, BrNO2, BrNO3, MPN, ISOPN, MOBA, PROPNN, HAC, GLYC, MMN, RIP, IEPOX, MAP, NO2, NO3, HNO2, OH |
| Comments on ZONAL MEAN differences: |
|
| In the EMISSION RATIO maps, list all species that changed by 10% or more: |
|
| Comments on EMISSION RATIO differences: |
|
| Additional or summary comments: |
|
| Approval | |
| Requires further investigation: | No |
| Approved by: | Bob Y. and Christoph Keller |
| Date of approval: | 06 Nov 2014 |
--Melissa Sulprizio 06:23, 6 November 2014 (EST)
--Bob Y. 10:13, 6 November 2014 (EST)
v10-01d
We performed two 1-month benchmark simulations for v10-01d:
- v10-01d_trop: 1-month benchmark with tropopsheric chemistry
- v10-01d_UCX: 1-month benchmark with UCX strat-trop chemistry (72 vertical levels)
1-month benchmark v10-01d with UCX chemistry
Here is the assessment form for 1-month benchmark simulation v10-01d with UCX chemistry (aka v10-01d_UCX).
| Description | |
|---|---|
| New features added into GEOS-Chem: |
Features affecting the full-chemistry simulation in this benchmark:
Features not affecting the full-chemistry simulation in this benchmark: |
| Developer name(s) and institution(s): |
|
| Version, resolution, met fields used: | v10-01, GEOS-FP (72L), 4x5, July 2013 |
| 1-month benchmark finished on: | Mon Jun 2 20:00:41 EDT 2014 |
| Performance statistics: |
|
| Compared to previous benchmark: | v10-01c with UCX chemistry |
| This update will impact: (select all that apply with boldface) |
Advection, BL Mixing, Convection, Met Fields, Dry Dep, Wet Dep, Stratosphere, Anthro Emiss, Biogenic Emiss, Biomass Emiss, Photolysis, Chemistry, Other (please specify): |
| Unit test results may be viewed at: | ftp://ftp.as.harvard.edu/gcgrid/geos-chem/1mo_benchmarks/v10-01/v10-01d/v10-01d_UCX/v10-01d.results.html |
| Plots may be viewed at: | ftp://ftp.as.harvard.edu/gcgrid/geos-chem/1mo_benchmarks/v10-01/v10-01d/v10-01d_UCX/ |
| Metrics | |
| Global mean OH (from log file): | 13.0813437885412 x 10⁵ molec/cm3 |
| Methyl chloroform lifetime: | 4.7621 years |
| Did either of these change by more than 5%? | No. The mean OH differs by -0.25%, and the MCF lifetime differs by 0.34%. |
| At the SURFACE, list all species that changed by 10% or more: | NO, PAN, ISOP, H2O2, MVK, MACR, PMN, PRPE, CH2O, N2O5, HNO4, MP, DMS, NIT, DST4, Br, ISOPN, MOBA, HAC, GLYC, MMN, RIP, IEPOX, MAP, Cl, OClO, Cl2O2, HO2 |
| Comments on SURFACE differences: |
|
| At 500 hPa, list all species that changed by 10% or more: | NO, ISOP, MVK, MACR, PMN, PRPE, CH2O, N2O5, DMS, NH3, NIT, DST4, BrNO2, ISOPN, MOBA, HAC, GLYC, MMN, RIP, IEPOX, MAP, Cl, OClO, Cl2O2 |
| Comments on 500 hPa differences: |
|
| In the ZONAL MEAN differences, list all species that changed by 10% or more: | PAN, ALK4, ISOP, MVK, MACR, PMN, PRPE, C3H8, N2O5, SO4s, NH3, NIT, NITs, DST2, DST3, SALC, Br, BrNO3, ISOPN, MOBA, HAC, MMN, RIP, IEPOX, MAP, OCS, CCl4, CH3CCl3, CFC11, H1211, H1301, H2402, Cl, ClNO2, Cl2O2 |
| Comments on ZONAL MEAN differences: |
|
| In the EMISSION RATIO maps, list all species that changed by 10% or more: | None |
| Comments on EMISSION RATIO differences: |
|
| Additional or summary comments: |
|
| Approval | |
| Requires further investigation: | NO |
| Approved by: | Melissa Sulprizio and Bob Yantosca |
| Date of approval: | 03 Jun 2014 |
--Melissa Sulprizio 14:47, 2 June 2014 (EDT)
--Bob Y. 11:39, 3 June 2014 (EDT)
1-month benchmark v10-01d with tropospheric chemistry
Here is the assessment form for 1-month benchmark simulation v10-01d with tropospheric chemistry (aka v10-01d_trop).
| Description | |
|---|---|
| New features added into GEOS-Chem: |
Features affecting the full-chemistry simulation in this benchmark:
Features not affecting the full-chemistry simulation in this benchmark: |
| Developer name(s) and institution(s): |
|
| Version, resolution, met fields used: | v10-01, GEOS-FP (47L), 4x5, July 2013 |
| 1-month benchmark finished on: | Mon Jun 16 13:24:57 EDT 2014 |
| Performance statistics: |
|
| Compared to previous benchmark: | v10-01c with tropospheric chemistry |
| This update will impact: (select all that apply with boldface) |
Advection, BL Mixing, Convection, Met Fields, Dry Dep, Wet Dep, Stratosphere, Anthro Emiss, Biogenic Emiss, Biomass Emiss, Photolysis, Chemistry, Other (please specify): |
| Unit test results may be viewed at: | ftp://ftp.as.harvard.edu/gcgrid/geos-chem/1mo_benchmarks/v10-01/v10-01d/v10-01d_trop/v10-01d.results.html |
| Plots may be viewed at: | ftp://ftp.as.harvard.edu/gcgrid/geos-chem/1mo_benchmarks/v10-01/v10-01d/v10-01d_trop/ |
| Metrics | |
| Global mean OH (from log file): | 13.5883620833673 x 10⁵ molec/cm3 |
| Methyl chloroform lifetime: | 4.7516 years |
| Did either of these change by more than 5%? | No. The mean OH differs by -0.29%, and the MCF lifetime differs by 0.35%. |
| At the SURFACE, list all species that changed by 10% or more: | NO, PAN, ISOP, H2O2, MVK, MACR, PMN, PRPE, CH2O, N2O5, HNO4, MP, DMS, NIT, DST4, Br, BrO, ISOPN, MOBA, HAC, GLYC, MMN, RIP, IEPOX, MAP |
| Comments on SURFACE differences: |
|
| At 500 hPa, list all species that changed by 10% or more: | NO, ISOP, MVK, MACR, PMN, PRPE, CH2O, N2O5, DMS, NH3, NIT, DST4, BrNO2, BrNO3, ISOPN, MOBA, HAC, GLYC, MMN, RIP, IEPOX, MAP |
| Comments on 500 hPa differences: |
|
| In the ZONAL MEAN differences, list all species that changed by 10% or more: | NO, ALK4, ISOP, MVK, MACR, PMN, PRPE, C3H8, N2O5, SO4s, NH3, NIT, NITs, ISOPN, MOBA, HAC, GLYC, MMN, RIP, IEPOX, MAP |
| Comments on ZONAL MEAN differences: |
|
| In the EMISSION RATIO maps, list all species that changed by 10% or more: | None |
| Comments on EMISSION RATIO differences: |
|
| Additional or summary comments: |
|
| Approval | |
| Requires further investigation: | NO |
| Approved by: | Melissa Sulprizio and Bob Yantosca |
| Date of approval: | 03 Jun 2014 |
--Melissa Sulprizio 14:47, 2 June 2014 (EDT)
--Bob Y. 11:39, 3 June 2014 (EDT)
v10-01c
Because GEOS-Chem v10-01c was the version where we introduced the UCX chemistry mechanism, we performed two 1-month benchmark simulations:
- v10-01c_trop: 1-month benchmark with tropopsheric chemistry
- v10-01c_UCX: 1-month benchmark with UCX strat-trop chemistry (72 vertical levels)
--Bob Y. 13:15, 30 May 2014 (EDT)
Final recommendation for J-values
We were not able to include this final recommendation for J(HAC) and J(PAN) into the v10-01c_trop and v10-01c_UCX 1-month benchmarks. We will include these in the 1-year benchmarks for v10-01c.
--Bob Y. 17:16, 30 May 2014 (EDT)
1-month benchmark v10-01c with UCX chemistry
Here is the assessment form for 1-month benchmark simulation v10-01c with UCX chemistry (aka v10-01c_UCX).
| Description | |
|---|---|
| New features added into GEOS-Chem: |
Features affecting the chemistry in this benchmark:
Features not affecting the chemistry in this benchmark:
|
| Developer name(s) and institution(s): |
|
| Version, resolution, met fields used: | v10-01, GEOS-FP (72L), 4x5, July 2013 |
| 1-month benchmark finished on: | Thu May 29 00:01:33 2014 |
| Performance statistics: |
|
| Compared to previous benchmark: | v10-01c with tropospheric chemistry |
| This update will impact: (select all that apply with boldface) |
Advection, BL Mixing, Convection, Met Fields, Dry Dep, Wet Dep, Stratosphere, Anthro Emiss, Biogenic Emiss, Biomass Emiss, Photolysis, Chemistry, Other (please specify): |
| Unit test results may be viewed at: | ftp://ftp.as.harvard.edu/gcgrid/geos-chem/1mo_benchmarks/v10-01/v10-01c/v10-01c_UCX/v10-01c_Final.results.html |
| Plots may be viewed at: | ftp://ftp.as.harvard.edu/gcgrid/geos-chem/1mo_benchmarks/v10-01/v10-01c/v10-01c_UCX/ |
| Metrics | |
| Global mean OH (from log file): | 13.1136815995777 x 10⁵ molec/cm3 |
| Methyl chloroform lifetime: | 4.7459 years |
| Did either of these change by more than 5%? | No. The mean OH differs by -3.77%, and the MCF lifetimes differ by 0.23%. |
| At the SURFACE, list all species that changed by 10% or more: | NO, PAN, ALK4, ISOP, HNO3, H2O2, MEK, RCHO, MVK, MACR, PMN, PPN, PRPE, N2O5, HNO4, MP, DMS, SO4s, NH3, NIT, NITs, DST4, Br2, Br, BrO, HBr, BrNO2, BrNO3, MPN, ISOPN, MOBA, HAC, GLYC, MMN, RIP, IEPOX, NO2, NO3, HNO2, OH, HO2 |
| Comments on SURFACE differences: |
|
| At 500 hPa, list all species that changed by 10% or more: | NO, ALK4, ISOP, HNO3, MEK, RCHO, MVK, MACR, PMN, PRPE, C3H8, N2O5, HNO4, MP, DMS, SO2, NH3, NIT, NITs, DST4, Br2, Br, BrO, HBr, BrNO2, BrNO3, MPN, ISOPN, MOBA, HAC, GLYC, MMN, RIP, IEPOX, NO2, NO3, HNO2, OH, HO2 |
| Comments on 500 hPa differences: |
|
| In the ZONAL MEAN differences, list all species that changed by 10% or more: | All species, except for MSA and OCPI, changed by 10% or more. |
| Comments on ZONAL MEAN differences: |
|
| In the EMISSION RATIO maps, list all species that changed by 10% or more: | None |
| Comments on EMISSION RATIO differences: |
|
| Additional or summary comments: |
|
| Approval | |
| Requires further investigation: | NO |
| Approved by: | Daniel Jacob, Jingqiu Mao, Sebastian Eastham |
| Date of approval: | 29 May 2014 |
--Bob Y. 13:11, 30 May 2014 (EDT)
1-month benchmark v10-01c with tropospheric chemistry
Here is the assessment form for 1-month benchmark simulation v10-01c with tropospheric chemistry (i.e. UCX off, aka v10-01c_trop).
| Description | |
|---|---|
| New features added into GEOS-Chem: |
Features affecting the chemistry in this benchmark: Features not affecting the chemistry in this benchmark:
|
| Developer name(s) and institution(s): |
|
| Version, resolution, met fields used: | v10-01, GEOS-FP (47L), 4x5, July 2013 |
| 1-month benchmark finished on: | Wed May 28 17:57:45 2014 |
| Performance statistics: |
|
| Compared to previous benchmark: | v10-01b |
| This update will impact: (select all that apply with boldface) |
Advection, BL Mixing, Convection, Met Fields, Dry Dep, Wet Dep, Stratosphere, Anthro Emiss, Biogenic Emiss, Biomass Emiss, Photolysis, Chemistry, Other (please specify): |
| Unit test results may be viewed at: | ftp://ftp.as.harvard.edu/gcgrid/geos-chem/1mo_benchmarks/v10-01/v10-01c/v10-01c_trop/v10-01c_Final.results.html |
| Plots may be viewed at: | ftp://ftp.as.harvard.edu/gcgrid/geos-chem/1mo_benchmarks/v10-01/v10-01c/v10-01c_trop |
| Metrics | |
| Global mean OH (from log file): | 13.6273583437531 x 10⁵ molec/cm3 |
| Methyl chloroform lifetime: | 4.7349 years |
| Did either of these change by more than 5%? | No. The mean OH differs by -0.77%, and the MCF lifetimes differ by 1.37%. |
| At the SURFACE, list all species that changed by 10% or more: | NO, PAN, ALK4, ISOP, H2O2, MEK, RCHO, MVK, MACR, PMN, PPN, PRPE, CH2O, N2O5, HNO4, MP, DMS, NIT, DST4, Br2, Br, BrO, HOBr, HBr, BrNO2, BrNO3, MPN, ISOPN, MOBA, PROPNN, HAC, GLYC, MMN, RIP, IEPOX, MAP, NO3, HNO2, OH, HO2 |
| Comments on surface differences: |
|
| At 500 hPa, list all species that changed by 10% or more: | NO, PAN, ALK4, ISOP, H2O2, ACET, MEK, MVK, MACR, PMN, PRPE, CH2O, N2O5, HNO4, MP, DMS, SO2, NH3, NIT, DST4, Br2, Br, BrO, BrNO2, BrNO3, ISOPN, MOBA, PROPNN, HAC, GLYC, MMN, RIP, IEPOX, MAP, NO2, NO3, HNO2 |
| Comments on 500 hPa differences: |
|
| In the ZONAL MEAN differences, list all species that changed by 10% or more: | NO, PAN, ALK4, ISOP, H2O2, ACET, MEK, MVK, MACR, PMN, PRPE, C3H8, CH2O, N2O5, MP, DMS, SO4s, NH3, NIT, NITs, Br2, Br, BrO, HOBr, BrNO2, BrNO3, MPN, ISOPN, MOBA, HAC, GLYC, MMN, RIP, IEPOX, MAP, NO3, HNO2, OH, HO2 |
| Comments on ZONAL MEAN differences: |
|
| In the EMISSION RATIO maps, list all species that changed by 10% or more: | None |
| Comments on EMISSION RATIO differences: |
|
| Additional or summary comments: |
|
| Approval | |
| Requires further investigation: | NO |
| Approved by: | Daniel Jacob, Jingqiu Mao, Sebastian Eastham |
| Date of approval: | 29 May 2014 |
--Bob Y. 14:20, 30 May 2014 (EDT)
v10-01b
Here is the assessment form for 1-month benchmark simulation v10-01b.
| Description | |
|---|---|
| New features added into GEOS-Chem: | |
| Developer name(s) and institution(s): |
|
| Version, resolution, met fields used: | v10-01, GEOS-FP (47L), 4x5, July 2013 |
| 1-month benchmark finished on: | Wed Mar 5 15:06:00 EST 2014 |
| Performance statistics: |
|
| Compared to previous benchmark: | v10-01a |
| This update will impact: (select all that apply with boldface) |
Advection, BL Mixing, Convection, Met Fields, Dry Dep, Wet Dep, Stratosphere, Anthro Emiss, Biogenic Emiss, Biomass Emiss, Photolysis, Chemistry, Other (please specify): |
| Plots may be viewed at: | ftp://ftp.as.harvard.edu/gcgrid/geos-chem/1mo_benchmarks/v10-01/v10-01b/ |
| Metrics | |
| Global mean OH (from log file): | 13.7339945052522 x 10⁵ molec/cm3 |
| Methyl chloroform lifetime: | 4.6706 years |
| Did either of these change by more than 5%? | No. Both the mean OH and MCF lifetimes differ by < 0.01%. |
| At the SURFACE, list all species that changed by 10% or more: | NO, ISOP, MVK, MACR, PMN, NIT, DST4, ISOPN, MOBA, RIP |
| Comments on SURFACE differences: |
|
| At 500 hPa, list all species that changed by 10% or more: | NO, ISOP, NH3, NIT, DST4, ISOPN, MOBA, RIP |
| Comments on 500 hPa differences: |
|
| In the ZONAL MEAN differences, list all species that changed by 10% or more: | ALK4, ISOP, C3H8, SO4s, NH3, NIT, GLYC |
| Comments on ZONAL MEAN differences: |
|
| In the EMISSION RATIO maps, list all species that changed by 10% or more: | None |
| Comments on EMISSION RATIO differences: | |
| Additional or summary comments: |
|
| Approval | |
| Requires further investigation: | No |
| Approved by: | Jenny Fisher, Fabien Paulot |
| Date of approval: | 06 Mar 2014 |
--Melissa Sulprizio 11:34, 6 March 2014 (EST)
v10-01a
Here is the assessment form for 1-month benchmark simulation v10-01a.
| Description | |
|---|---|
| New features added into GEOS-Chem: | |
| Developer name(s) and institution(s): |
|
| Version, resolution, met fields used: | v10-01, GEOS-FP (47L), 4x5, July 2013 |
| 1-month benchmark finished on: | Mon Feb 3 15:05:32 EST 2014 |
| Performance statistics: |
|
| Compared to previous benchmark: | v9-02r w/ GEOS-FP meteorology |
| This update will impact: (select all that apply with boldface) |
Advection, BL Mixing, Convection, Met Fields, Dry Dep, Wet Dep, Stratosphere, Anthro Emiss, Biogenic Emiss, Biomass Emiss, Photolysis, Chemistry, Other (please specify): |
| Plots may be viewed at: | ftp://ftp.as.harvard.edu/gcgrid/geos-chem/1mo_benchmarks/v10-01/v10-01a/ |
| Metrics | |
| Global mean OH (from log file): | 13.7338316128900 x 10⁵ molec/cm3 |
| Methyl chloroform lifetime: | 4.6707 years |
| Did either of these change by more than 5%? | No. The mean OH differs by -0.02%, and the MCF lifetimes differ by 0.07%. |
| At the SURFACE, list all species that changed by 10% or more: | NO, O3, PAN, ISOP, HNO3, H2O2, MEK, ALD2, RCHO, MVK, MACR, PMN, PPN, R4N2, PRPE, N2O5, DMS, NH3, NH4, NIT, OCPI, DST4, Br2, Br, BrO, HOBr, HBr, BrNO2, BrNO3, MPN, ISOPN, MOBA, PROPNN, HAC, GLYC, MMN, RIP, IEPOX, MAP, NO3, OH |
| Comments on SURFACE differences: |
|
| At 500 hPa, list all species that changed by 10% or more: | NO, ISOP, MVK, MACR, PMN, PRPE, N2O5, DMS, NH3, NIT, DST4, Br2, ISOPN, MOBA, HAC, GLYC, MMN, RIP, IEPOX, NO3 |
| Comments on 500 hPa differences: |
|
| In the ZONAL MEAN differences, list all species that changed by 10% or more: | NO, ALK4, ISOP, MVK, MACR, PMN, PRPE, C3H8, N2O5, NH3, NIT, NITs, DST4, Br2, ISOPN, MOBA, HAC, GLYC, MMN, RIP, IEPOX |
| Comments on ZONAL MEAN differences: |
|
| In the EMISSION RATIO maps, list all species that changed by 10% or more: | ISOP, ACET, OC, PRPE, CO from monoterpenes |
| Comments on EMISSION RATIO differences: |
|
| Additional or summary comments: | We still need to determine what caused the changes in the MODIS LAI input files. As per our earlier discussion, we have put in an error trap in drydep_mod to make sure that the changes are only made for simulations using GEOS-FP and the Olson 2001 land map. |
| Approval | |
| Requires further investigation: | No |
| Approved by: | Patrick Kim |
| Date of approval: | 5 Feb 2014 |
--Melissa Sulprizio 12:16, 3 February 2014 (EST)