Linking GEOS-Chem to CMAQ
This page contains information about how to link the GEOS-Chem with the CMAQ regional air quality model.
Overview
Global models are increasingly used as time-variable boundary conditions to regional models. Previously, representative concentrations (from models or observations) were used to construct time-invariant boundaries. This prevents important variability in the contribution of grid-internal and grid-external concentrations. By linking to global models, regional models conceptually improve the grid-external sources and provide their own estimates of grid-internal sources. To connect regional and global models, there are conceptually 4 steps:
- Horizontal Interpolation - Since most regional models use a curvilinear grid, this is the simplest step.
- Vertical Interpolation - Many regional models use a pure sigma-pressure coordinate, which is different from GEOS-Chem's hybrid eta-sigma.
- Tracer translation - GEOS-Chem uses explicit and lumped chemical species (gas and particle), which require one-to-one, many-to-one, and one-to-many mapping to regional model tracers.
- Unit conversions - Translated tracers must be converted to regional model units to ensure compatibility.
- Meta Data - Regional model meta-data must be provided to ensure compatibility.
Any utility that accomplishes these steps can be used.
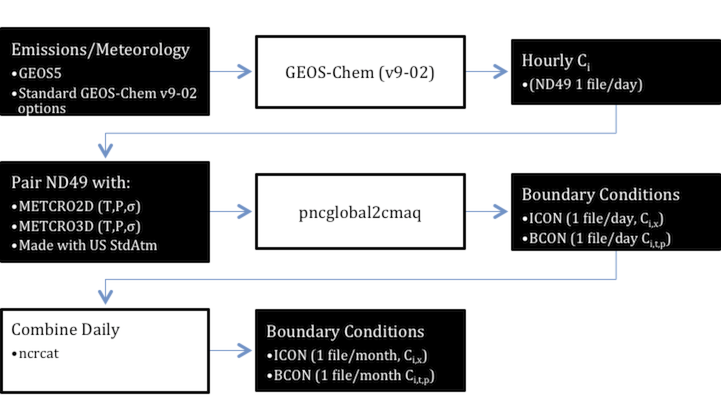
pncglobal2cmaq
pncglobal2cmaq.py is part of the PseudoNetCDF software package (http://github.com/barronh/pseudonetcdf). Installation instructions for PseudoNetCDF are available on its development page.
- Horizontal Interpolation - nearest neighbor with automatic conversion of CMAQ coordinates
- Pressure Interpolation - pressure vertical interpolation (recommended); pure GEOS-Chem eta to pure CMAQ sigma is an option if met files are unavailable.
- Tracer translation - Gas-phase translations for CB05 and SAPRC07 are provided; Aerosol translations to CMAQ AE5 and AE6 are provided; custom translations are also easy
- Unit conversion - dynamically converts units
- Meta Data - adds CMAQ meta-data to outputs automatically.
pncglobal2cmaq is compatible with chemistry, aerosols, and SOA aerosols from GEOS-Chem v8, v9 and v10. By default, it is configured with v9. It can easily be adapted to different versions by editing the mappings.json file (see below for more details). The gas-phase and AE5/AE6 options for v8 and v9 (pre v9-02) are documented in http://dx.doi.org/10.5194/gmd-7-339-2014 . The updates for v9-02 and beyond are not currently documented in the literature and should be reviewed see wiki notes.
A typical process has 3 steps and 2 pre-requisites and is described in the figure below. The pre-requisites are at least one CMAQ 3-D meteorology input for the inner domain (METCRO3D; only required for initial conditions) and one for the boundary (METBDY3D).
Run GEOS-Chem with ND49 enabled for the domain of interest
This section provides a minimal description of the GEOS-Chem simulation options necessary for pncglobal2cmaq.
- Enable ND49 for all layers (safer than trying to subset) with hourly (if not hourly, use the --tstep=HHMMSS option later).
- Define the domain to be inclusive of your domain (more is better).
- Output all tracers and, with v8, output pure NO, NO2 and O3.
- Output PSURF and TMPU -- these will be used for unit conversion and vertical interpolation. This can be problematic with SOA and versions v9-02 and higher where there are more than 90 tracers. If you run these diagnostics separately, they can be combined later (not described here).
Refer to the diagnostics appendix of your GEOS-Chem version to ensure that correct tracers are being output. I recommend running one day and then reviewing the output tracers using pncdump as described below. Careful review will prevent long delays later.
pncdump --header nd49/ts20100227.bpch | less
Process one or more days ND49 file
Prepare by creating a mapping definitions file. To get help with pncglobal2cmaq.py at any time, run "pncglobal2cmaq.py -h".
pncglobal2cmaq.py --template=cb05tucl_ae6_aq /path/to/anyfile > mappings.json
- "--template" can be set to cb05tucl_ae5_aq, cb05tucl_ae6_aq, saprc07_ae5_aq, saprc07_ae6_aq
- mappings.json can be modified as desired.
pncglobal2cmaq.py nd49/ts20100227.bpch --METBDY3D met/METBDY3D_20100227 --METCRO3D met/METCRO3D_20100227 --mapping=mappings.json --outifolder=icon/ --outbfolder=bcon/
- Folders nd49, met, bcon, and icon are not required -- adjust paths to be consistent with your setup.
- tracerinfo.dat and diaginfo.dat should be collocated with the Binary Punch (bpch) files,
- "mappings.json" is the path that you created in the last step,
- "--METCRO3D" is only necessary to create an initial condition file and can be omitted for any,
- "--METBDY3D" provides temperature and pressure for vertical interpolation and unit conversion.
Combine for CMAQ Simulation
CMAQ boundary files must have 25 instantaneous times per CMAQ simulation day. GEOS-Chem ND49 files typically have 24 times. Combine multiple days of output to ensure coverage (too much is okay) of all instantaneous times in CMAQ simulation. It is typical to use monthly BCON files for long simulations.
Combine Using PseudoNetCDF
pncgen --stack=TSTEP bcon/ts20100227.bpch.BCON.nc bcon/ts20100228.bpch.BCON.nc [...] bcon/ts2010041.bpch.BCON.nc bcon/ts201003.BCON.nc
This is equivalent to using NCO, which is another option.
ncrcat bcon/ts20100227.bpch.BCON.nc bcon/ts20100228.bpch.BCON.nc [...] bcon/ts2010041.bpch.BCON.nc bcon/ts201003.BCON.nc
GEOS-Chem based BCON Compared to Profile
Output files can be visualized using the PseudoNetCDF pncboundaries.py script.
With fewer options:
pncboundaries.py bcon/ts20060801.bpch.BCON.nc -v O3 -r TSTEP,mean bcon.ts201003.BCON.nc
With more options:
pncboundaries.py bcon/ts20060801.bpch.BCON.nc --states=True --norm="BoundaryNorm(np.logspace(0.025, 1, 9), 256) -v O3 -r TSTEP,mean bcon.ts201003.BCON.nc
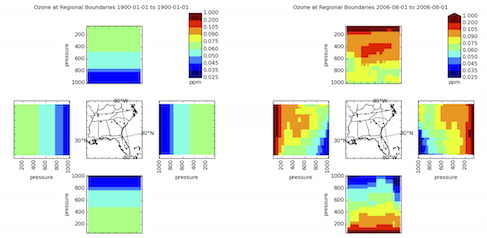
Below is a comparison of the CMAQ v5.0.2 standard BCON from "profiles" compared to the GEOS-Chem derived BCON. Note in GEOS-Chem, increasing ozone with altitude is seen as expected. PROFILE-based BCON has much lower ozone at high altitude because the data was collated before CMAQ top pressures were typically as high as they are now. Using the old profiles leads to exceptionally low ozone concentrations entering the domain in the upper boundaries.
--Barron H. 2016-09-08 13 (EST)
References
Known issues
SOA1, SOA2, SOA3, and SOA4 in G-C are outputed but are not converted to CB05 tracers. In CMAQ v4.7, 19 SOA species are defined. The CMAQ release notes do not fully explain them. So I will update this package when possible.
CMAQv5.0
Mapping for CMAQv5.0 with AERO6 including SOA --havala 16:14, 8 September 2011 (EDT)

