File list
This special page shows all uploaded files.
First page |
Previous page |
Next page |
Last page |
| Date | Name | Thumbnail | Size | User | Description | Versions |
|---|---|---|---|---|---|---|
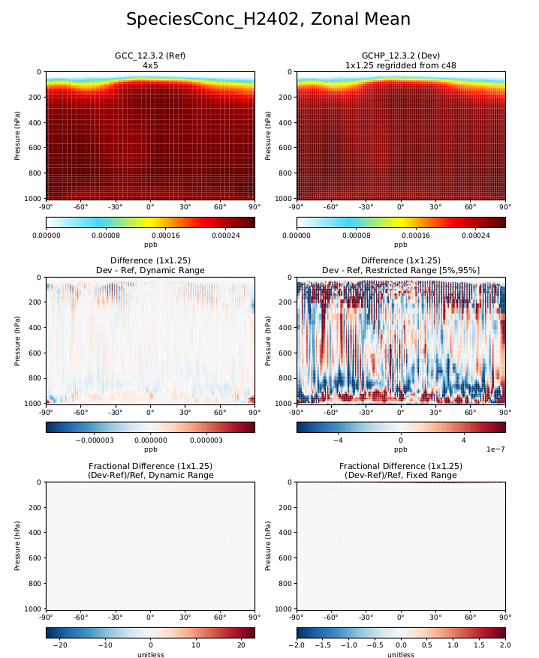
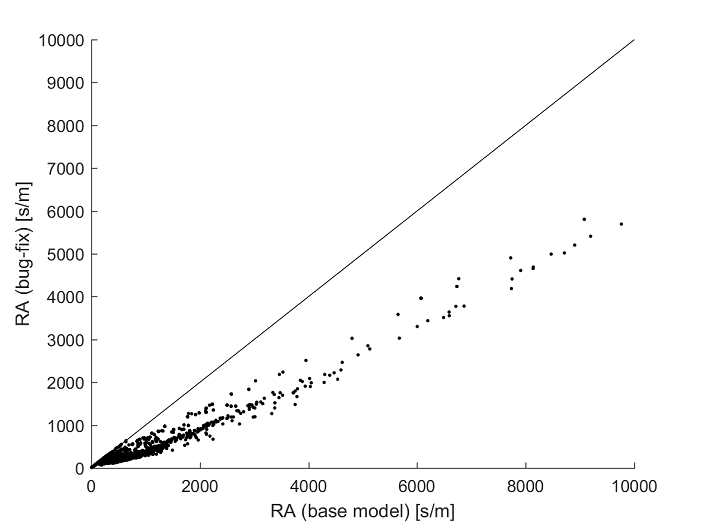
| 18:34, 16 April 2019 | H2402 issue resolved.png (file) |  |
275 KB | Bmy | Plot of H2402 using a new input file that resolves a prior issue. | 1 |
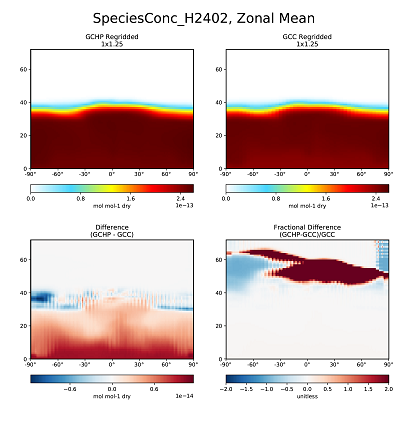
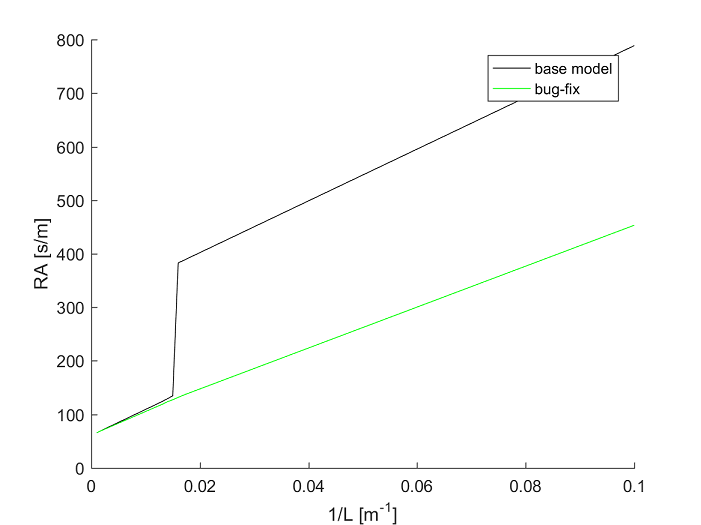
| 19:57, 7 December 2018 | H2402 issue.png (file) |  |
80 KB | Bmy | Shows issue with H2402 | 1 |
| 16:29, 27 August 2018 | Travis ci.png (file) |  |
12 KB | Bmy | Sample of Github commit with green checkmark | 1 |
| 20:30, 16 August 2018 | GEOS-Chem 12.0.0 timing results.pdf (file) | 1.69 MB | Bmy | PDF with a complete description of the 12.0.0 timing results | 1 | |
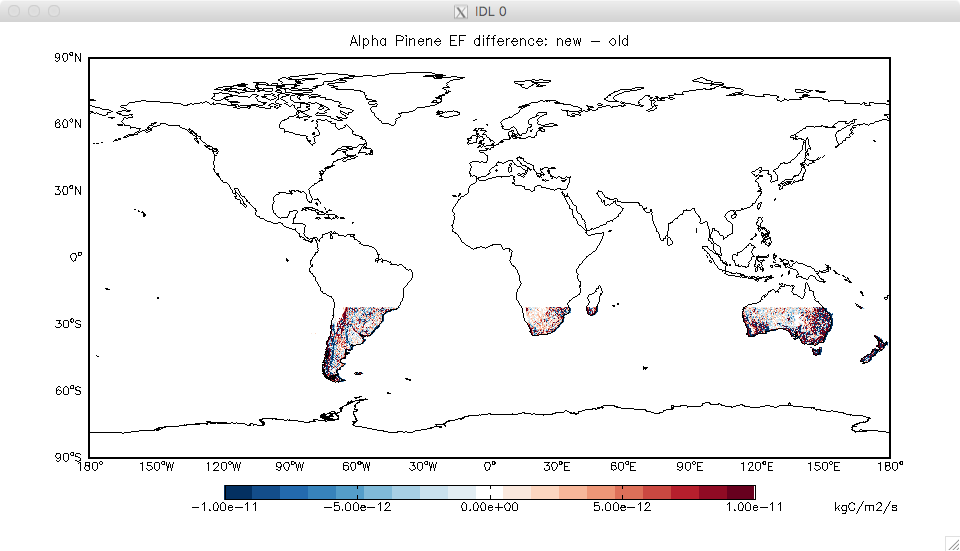
| 20:47, 31 May 2018 | MEGAN input file bug.png (file) |  |
36 KB | Lizzie Lundgren | Submitted by Jenny Fisher on 5/31/2018 | 1 |
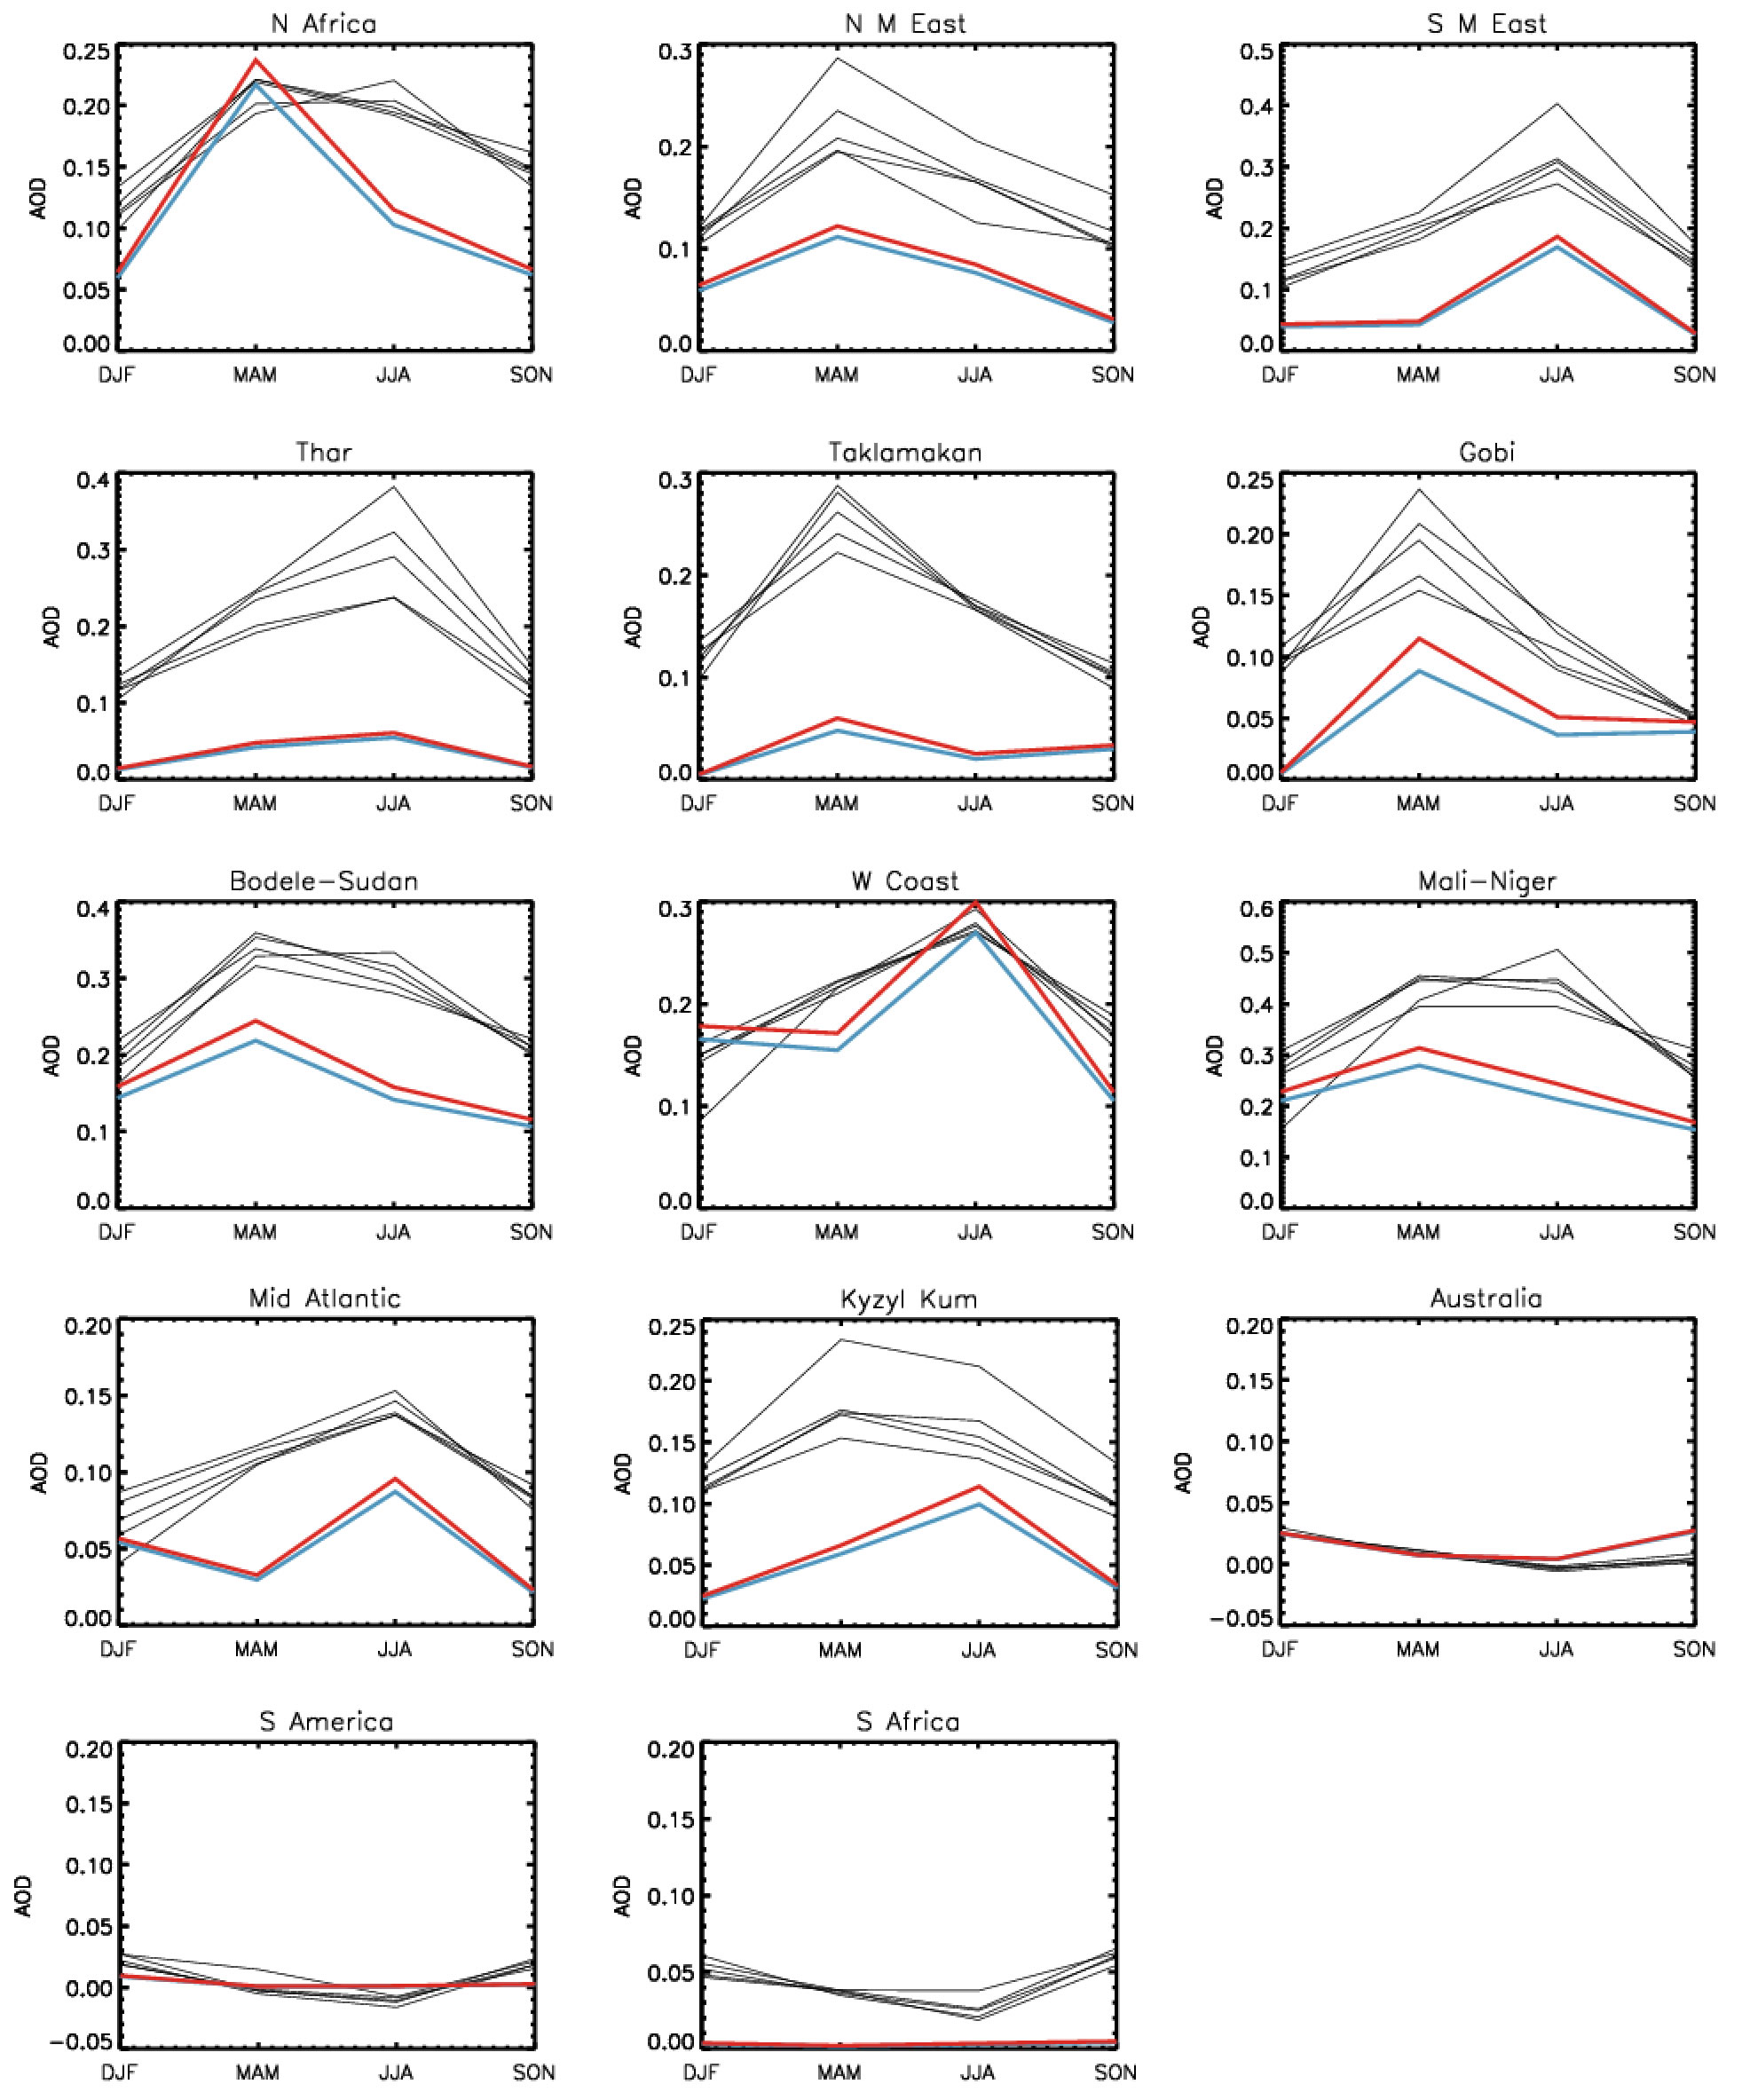
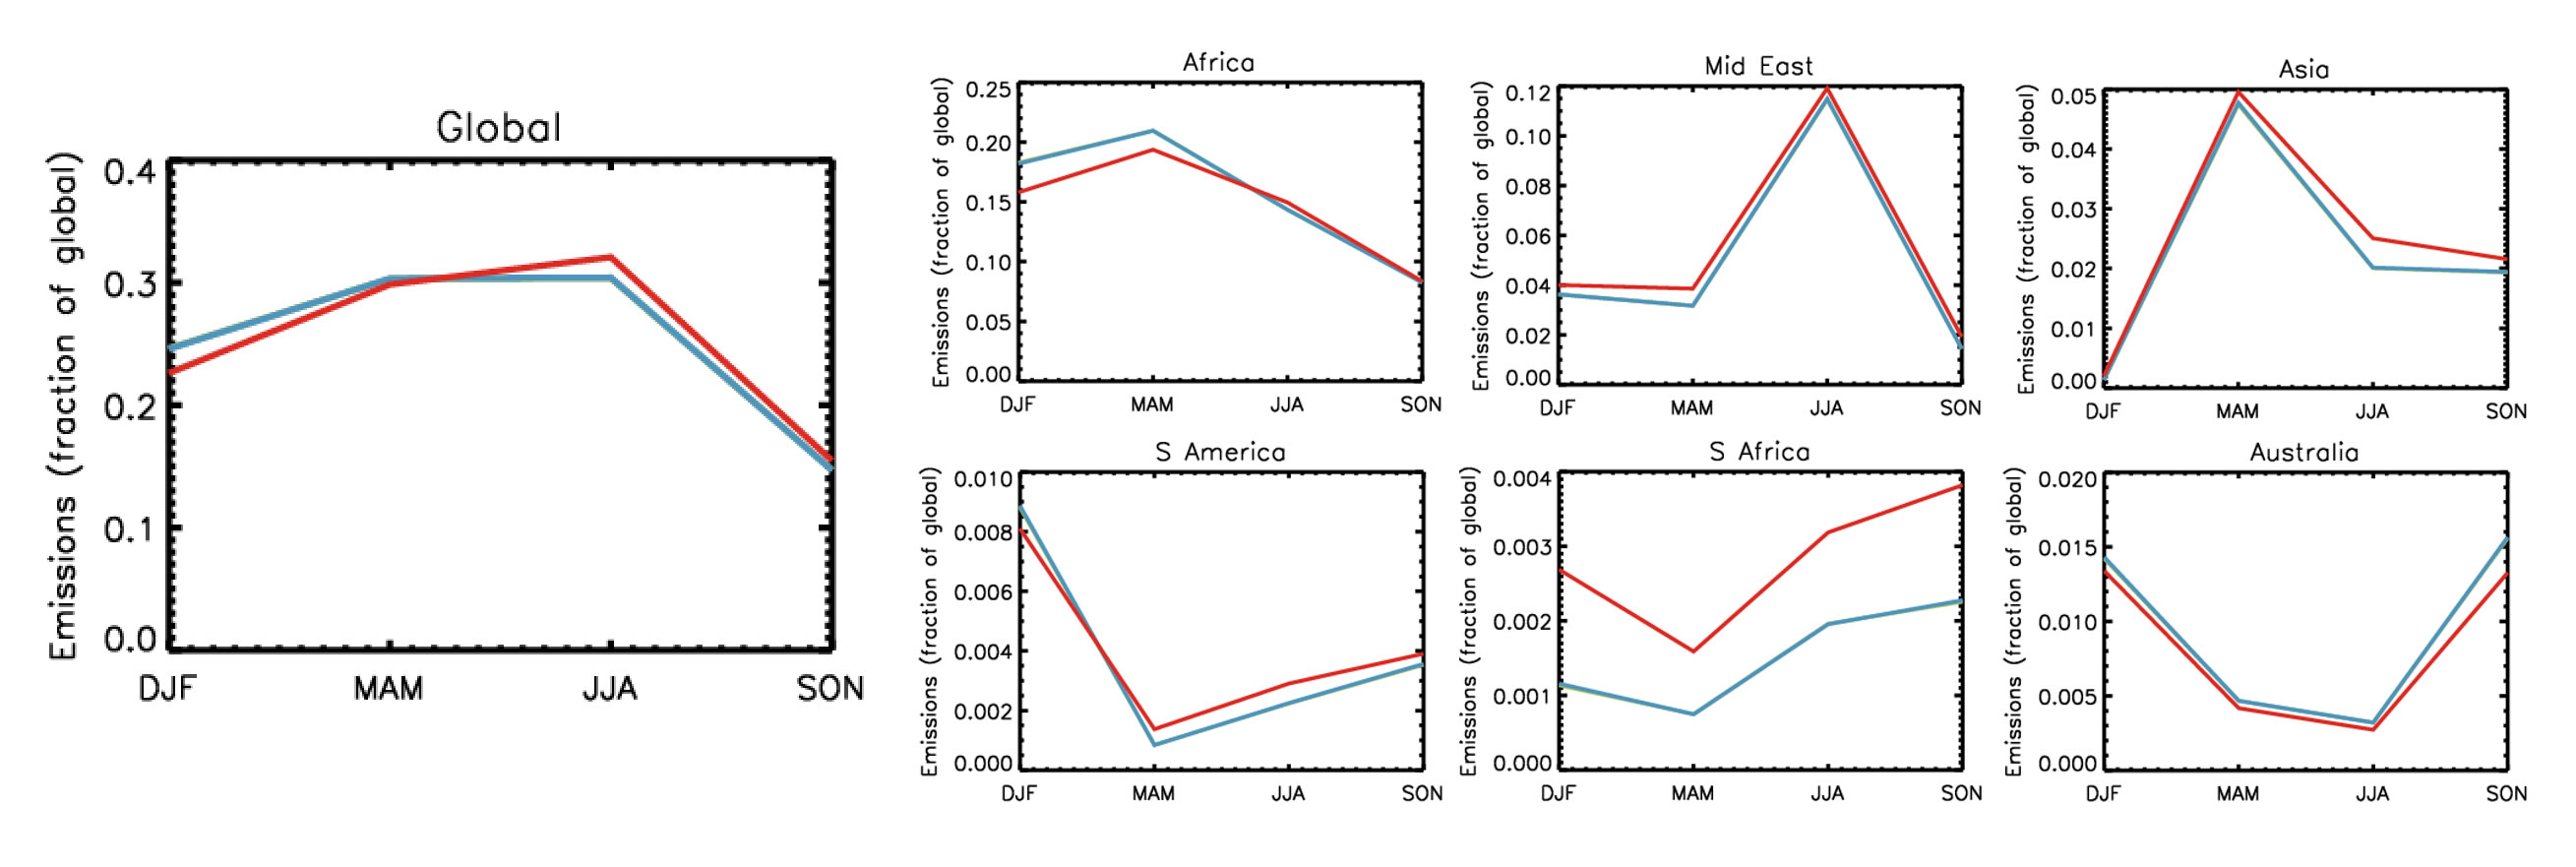
| 20:16, 29 April 2018 | DU Figure6.jpg (file) |  |
532 KB | David Ridley | 1 | |
| 20:16, 29 April 2018 | DU Figure5b.jpg (file) |  |
611 KB | David Ridley | 1 | |
| 20:16, 29 April 2018 | DU Figure5a.jpg (file) |  |
666 KB | David Ridley | 1 | |
| 20:16, 29 April 2018 | DU Figure4.jpg (file) |  |
134 KB | David Ridley | 1 | |
| 20:15, 29 April 2018 | DU Figure3.jpg (file) |  |
701 KB | David Ridley | 1 | |
| 20:15, 29 April 2018 | DU Figure2.jpg (file) |  |
212 KB | David Ridley | 1 | |
| 20:15, 29 April 2018 | DU Figure1.jpg (file) |  |
21 KB | David Ridley | 1 | |
| 17:19, 1 February 2018 | Map ph global.png (file) |  |
353 KB | Melissa Payer | Figure from Shaojie Song showing impacts of fix for ISORROPIA aerosol water pH calculations when the stable state for aerosol phase is applied. | 1 |
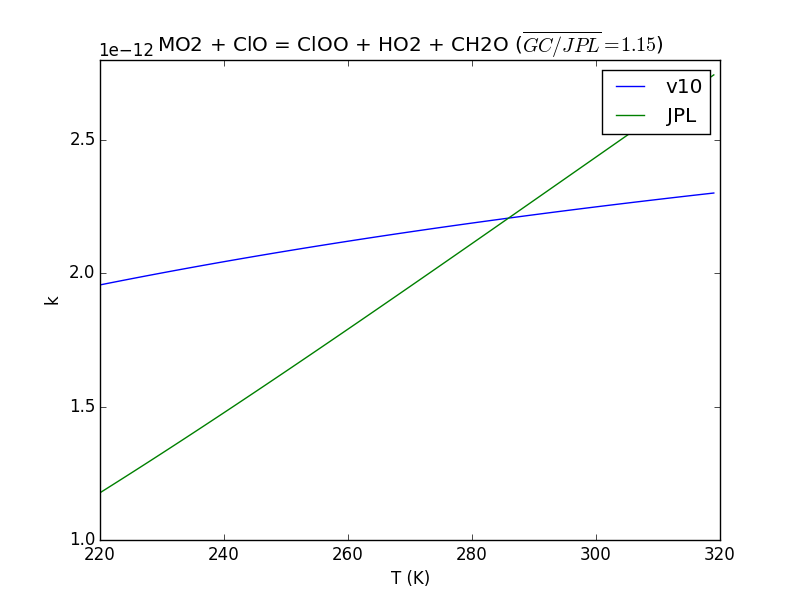
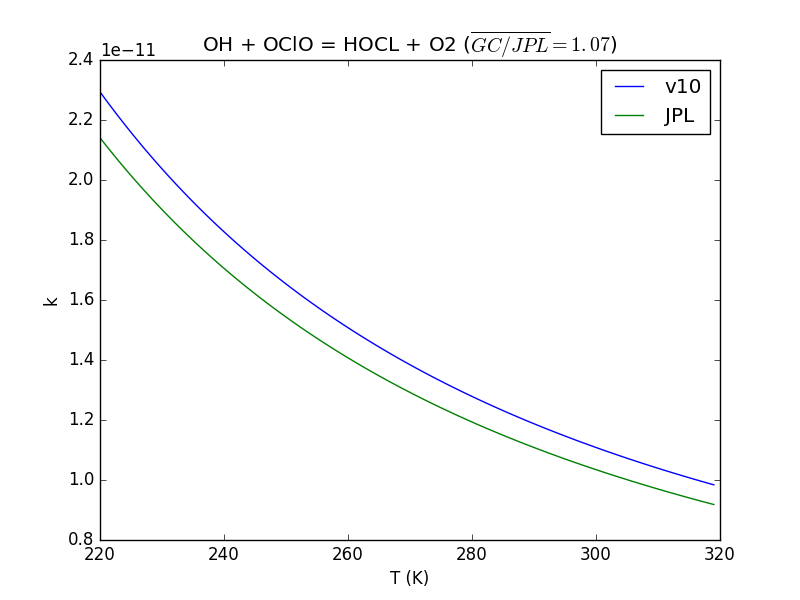
| 10:51, 20 March 2017 | JPL201510andGCv10 MO2plClO eq ClOOplHO2plCH2O.png (file) |  |
30 KB | Tomas Sherwen | Updated rate to assumed JPL15-10 rate. The A-factor has been assumed to be 1.8e-11 (not 1.8e-12 as JPL15-10). This assumption has been made as the provided rate in the JPL15-10 compilation for the rate at 298 is inconsistent with the statement in the... | 3 |
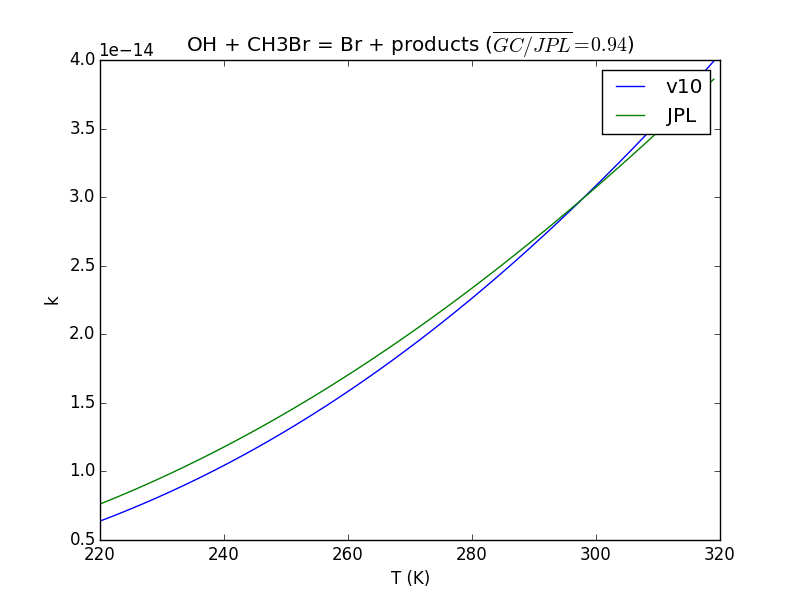
| 18:21, 8 March 2017 | JPL201510andGCv10 OHplCH3Br eq Brplproducts.png (file) |  |
37 KB | Tomas Sherwen | 2 | |
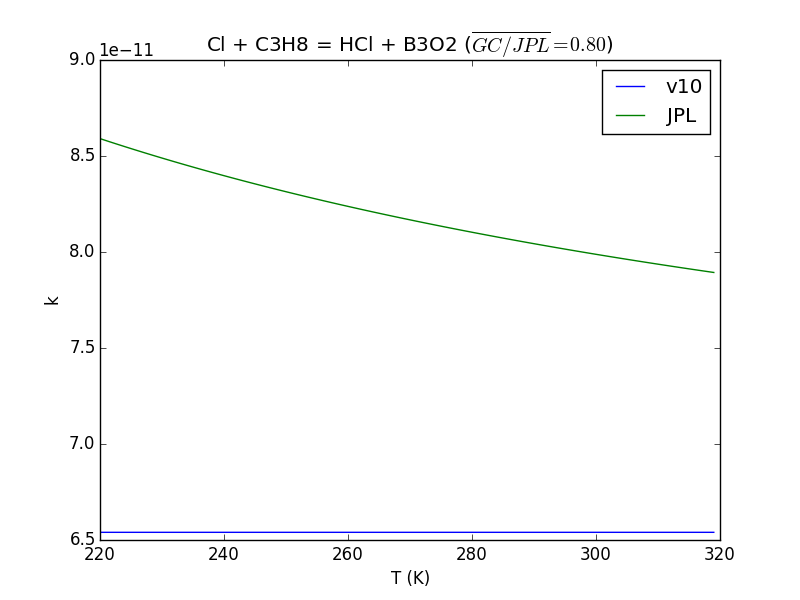
| 12:57, 6 March 2017 | JPL201510andGCv10 ClplC3H8 eq HClplB3O2.png (file) |  |
27 KB | Tomas Sherwen | 2 | |
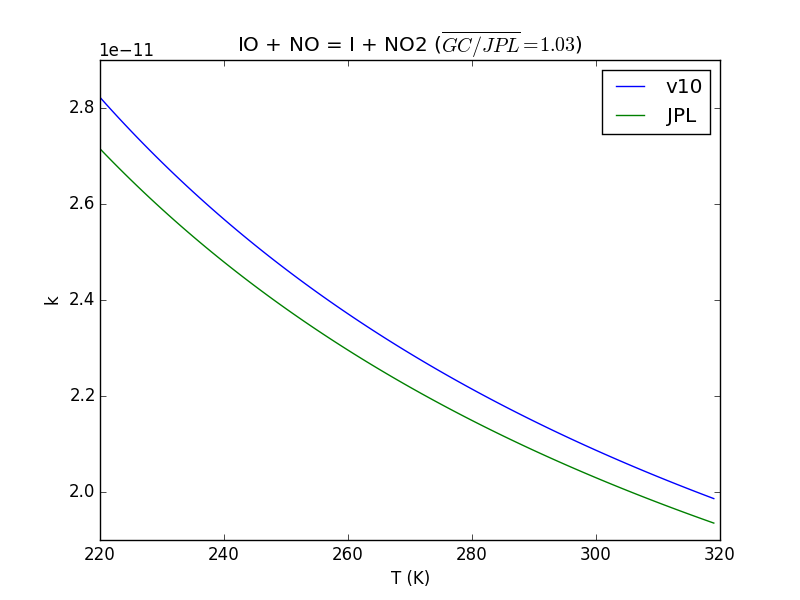
| 12:56, 6 March 2017 | JPL201510andGCv10 IOplNO eq IplNO2.png (file) |  |
37 KB | Tomas Sherwen | 2 | |
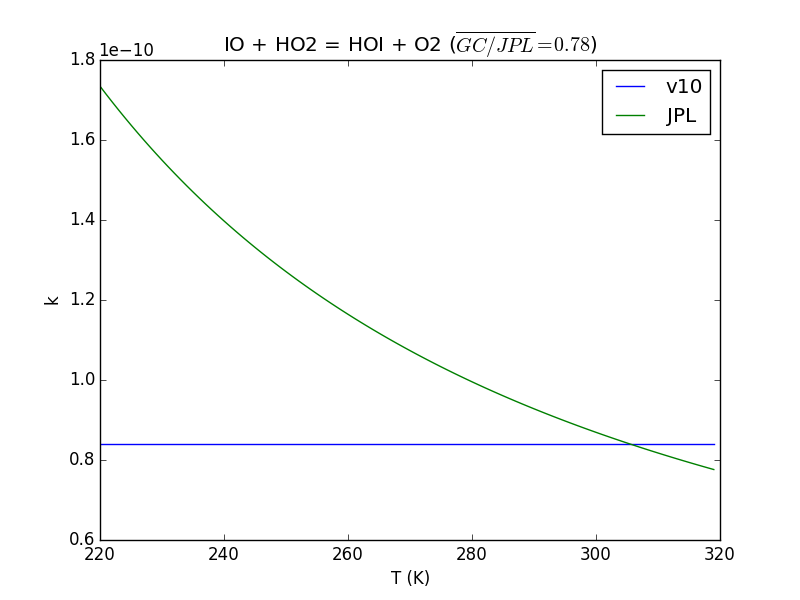
| 12:55, 6 March 2017 | JPL201510andGCv10 IOplHO2 eq HOIplO2.png (file) |  |
30 KB | Tomas Sherwen | 4 | |
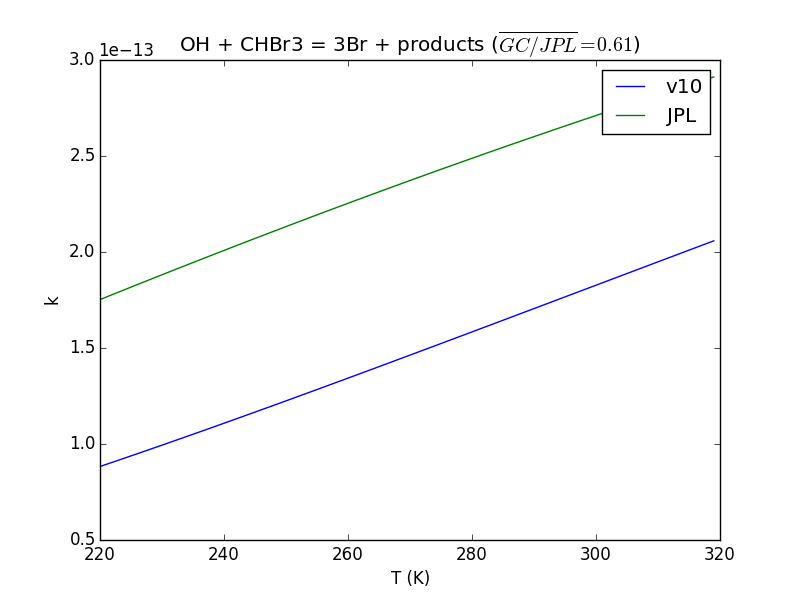
| 12:51, 6 March 2017 | JPL201510andGCv10 OHplCHBr3 eq 3Brplproducts.png (file) |  |
33 KB | Tomas Sherwen | 1 | |
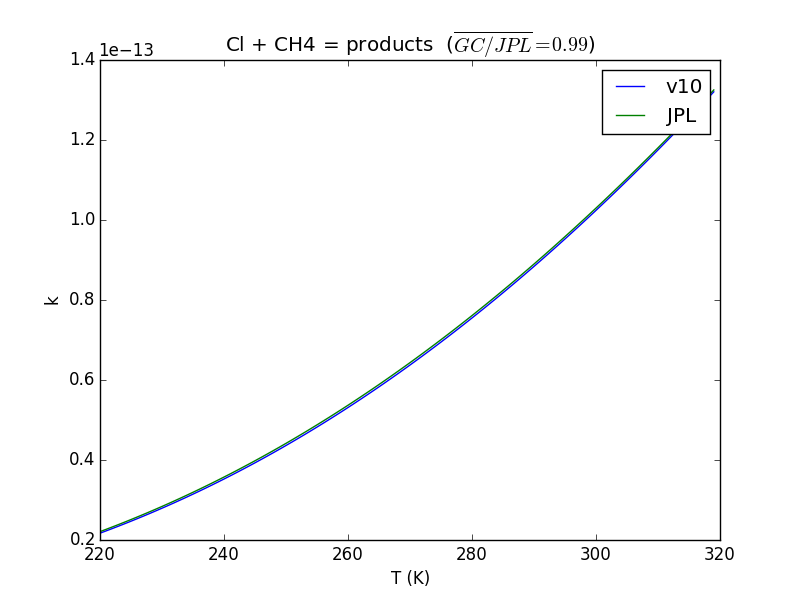
| 12:47, 6 March 2017 | JPL201510andGCv10 ClplCH4 eq products.png (file) |  |
34 KB | Tomas Sherwen | 2 | |
| 15:07, 24 February 2017 | Mass cons prec8 1yr vdiff.png (file) |  |
45 KB | Bmy | Evolution of tracer mass vs. time for a geosfp_2x25_masscons simulation (year 2013) with PRECISION=8 and VDIFF PBL mixing. | 1 |
| 15:07, 24 February 2017 | Mass cons prec4 1yr vdiff.png (file) |  |
43 KB | Bmy | Evolution of tracer mass vs. time for a geosfp_2x25_masscons simulation (year 2013) with PRECISION=4 and VDIFF PBL mixing. | 1 |
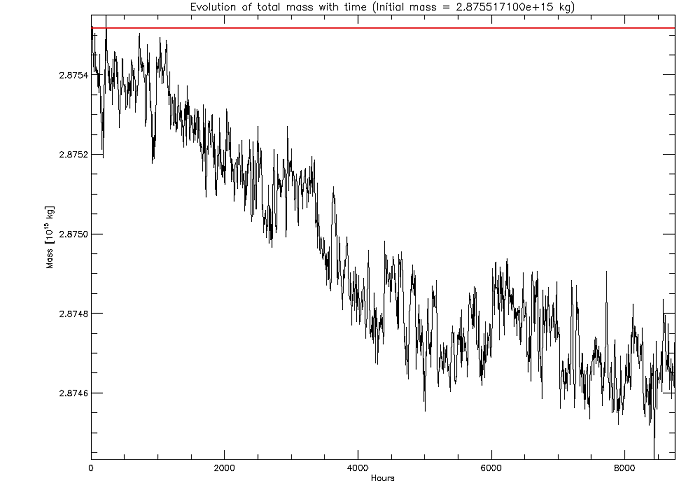
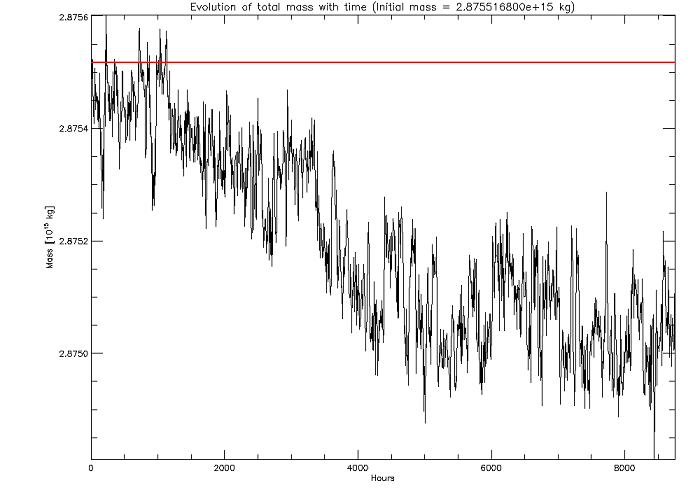
| 20:53, 23 February 2017 | Mass cons prec4 1yr.png (file) |  |
43 KB | Bmy | Evolution of tracer mass with time from a geosfp_2x25_masscons simulation for 2013. | 1 |
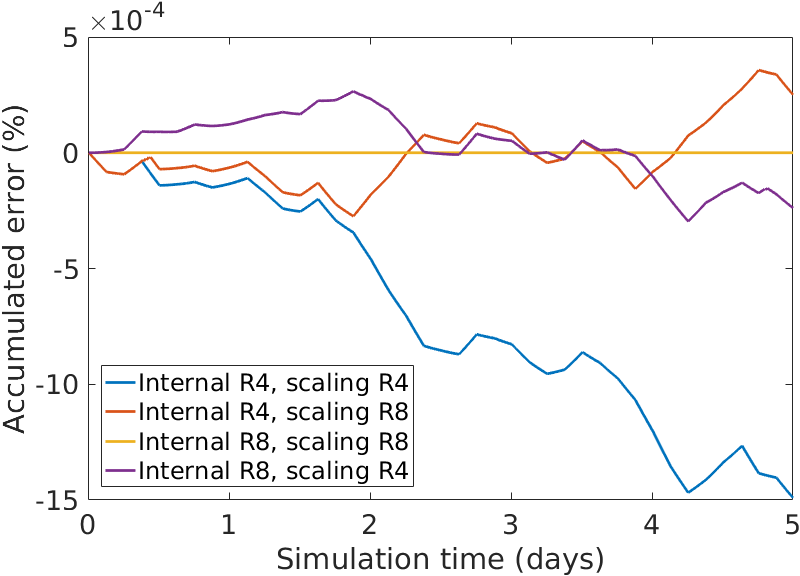
| 19:33, 23 February 2017 | Transport error v3 gchp.png (file) | 50 KB | Bmy | Shows transport error using various combinations of flexible precision in GCHP. | 1 | |
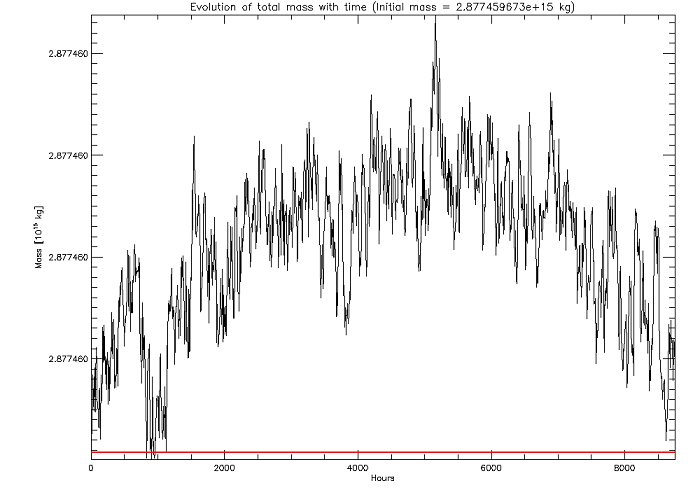
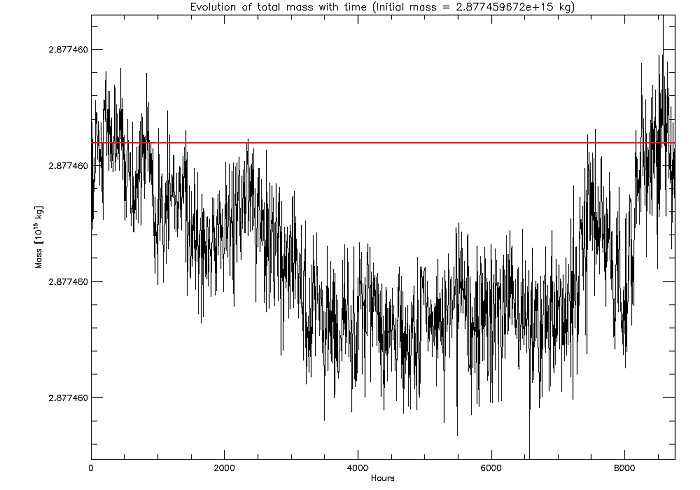
| 21:54, 22 February 2017 | Mass cons prec8 1yr.png (file) |  |
46 KB | Bmy | Evolution of tracer mass with time from a geosfp_2x25_masscons simulation using PRECISION=8 and TURBDAY PBL mixing for 2013. | 1 |
| 18:18, 17 February 2017 | Depvel figure 3.png (file) |  |
39 KB | Bmy | Figure #3 from Brian Boys | 1 |
| 18:18, 17 February 2017 | Depvel figure 2.png (file) |  |
40 KB | Bmy | Figure #2 from Brian Boys | 1 |
| 18:18, 17 February 2017 | Depvel figure 1.png (file) |  |
30 KB | Bmy | Figure # 1 from Brian Boys (smaller) | 1 |
| 19:54, 16 February 2017 | JPL201510andGCv10 OHplOClO eq HOClplO2.png (file) |  |
39 KB | Barronh | None, but could not activate previous version. Maybe because of name... | 7 |
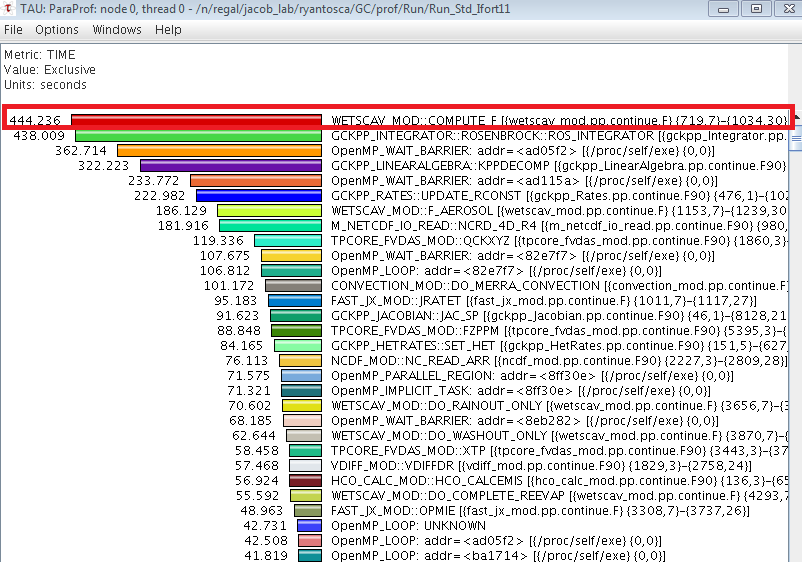
| 21:43, 8 February 2017 | V11-01-thread0.png (file) |  |
48 KB | Bmy | Profiling plot from TAU showing bottleneck in v11-01 convection module | 1 |
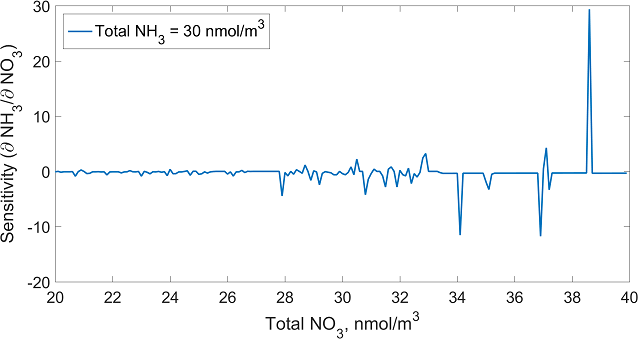
| 20:55, 23 January 2017 | ISORROPIASensitivity.png (file) |  |
31 KB | Bmy | Sensitivity of gas-phase NO3 to total NO3, by Seb Eastham | 1 |
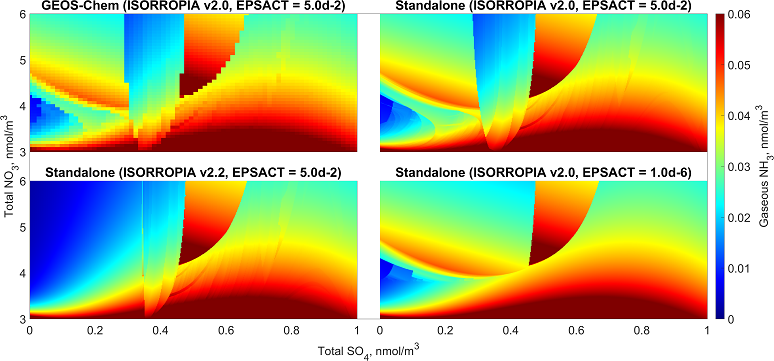
| 20:54, 23 January 2017 | ISORROPIAAnalysisSingle.png (file) |  |
149 KB | Bmy | Detail of nonconvergence regions by Seb Eastham | 1 |
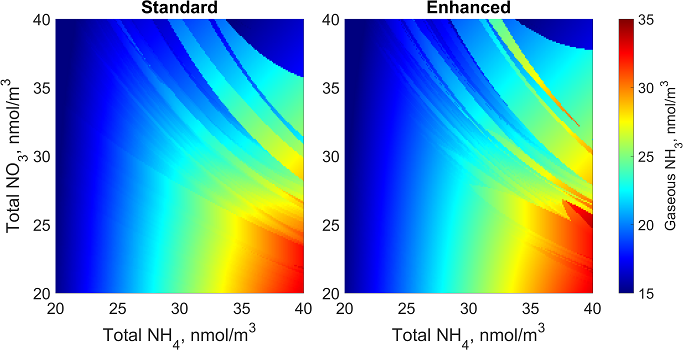
| 20:54, 23 January 2017 | ISORROPIAAnalysis.png (file) |  |
166 KB | Bmy | Parameter sweeps with ISORROPIA by Seb Eastham | 1 |
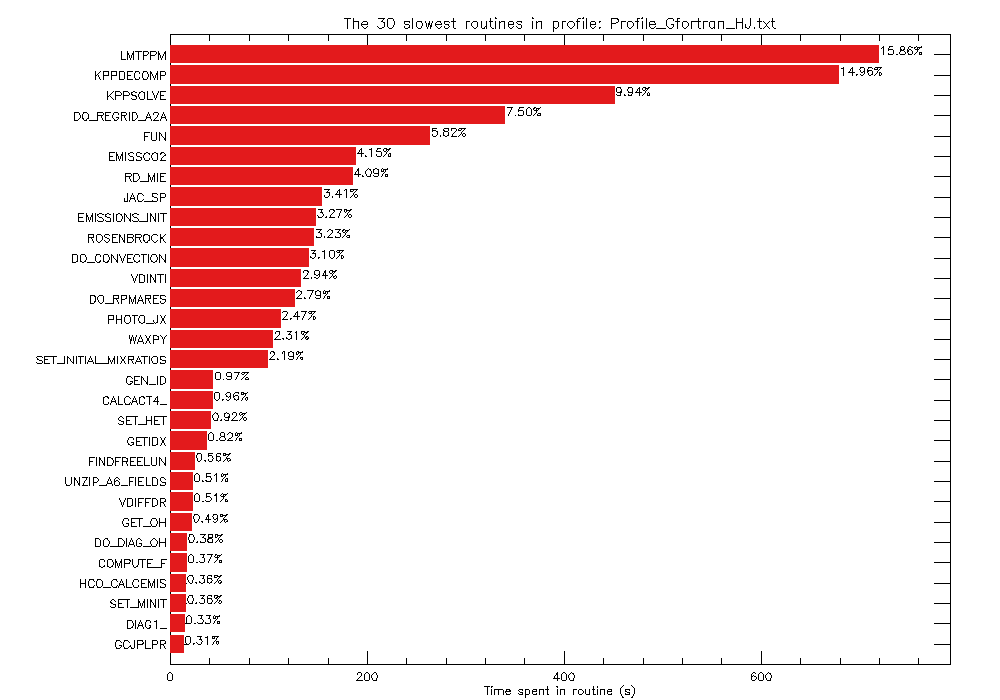
| 20:18, 15 December 2016 | Plot gprof output.png (file) |  |
14 KB | Bmy | Example plot from the GAMAP "plot_gprof.pro" routine. | 1 |
| 23:12, 6 December 2016 | MERRA2 05x0625 NA.png (file) |  |
8 KB | Melissa Payer | MERRA-2 0.5 x 0.625 nested NA grid | 1 |
| 23:12, 6 December 2016 | MERRA2 05x0625 EU.png (file) |  |
9 KB | Melissa Payer | MERRA-2 0.5 x 0.625 nested EU grid | 1 |
| 23:11, 6 December 2016 | MERRA2 05x0625 AS.png (file) |  |
7 KB | Melissa Payer | MERRA-2 0.5 x 0.625 nested AS grid | 1 |
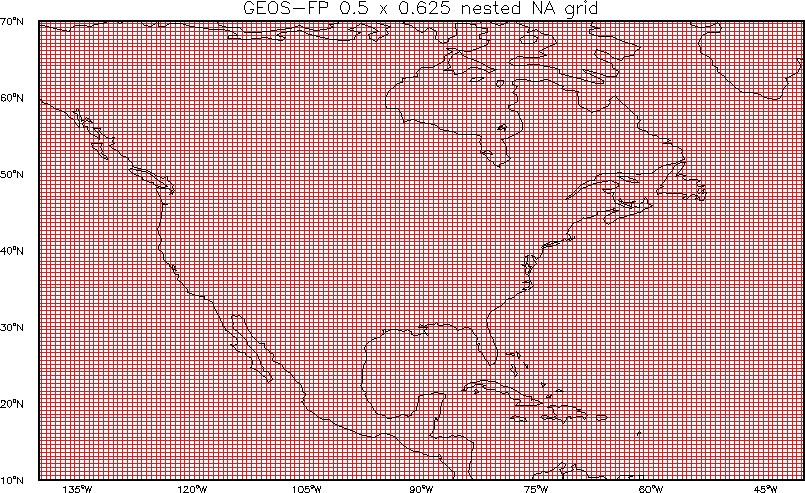
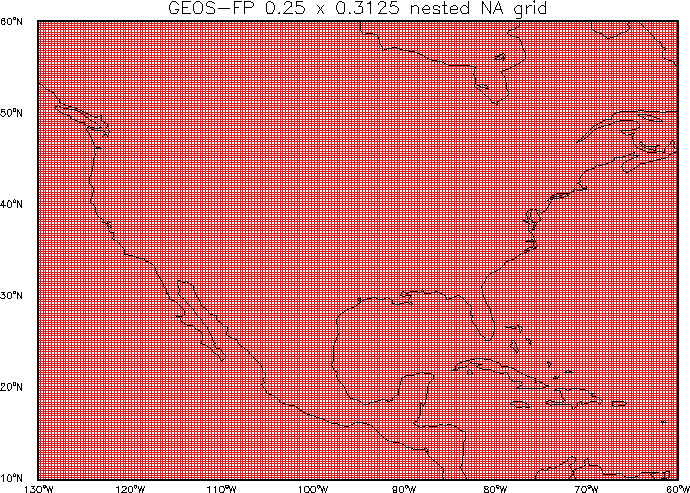
| 23:11, 6 December 2016 | GEOSFP 025x03125 NA.png (file) |  |
7 KB | Melissa Payer | GEOS-FP 0.25 x 0.3125 nested NA grid | 1 |
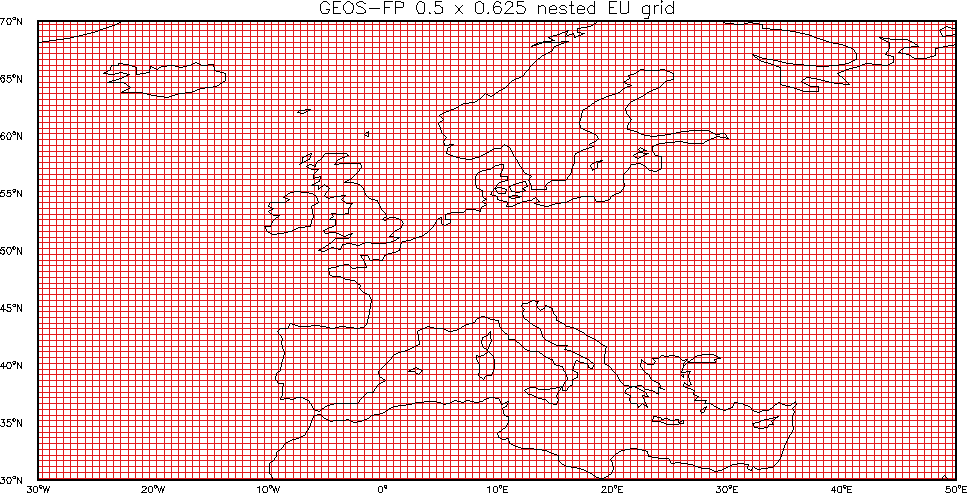
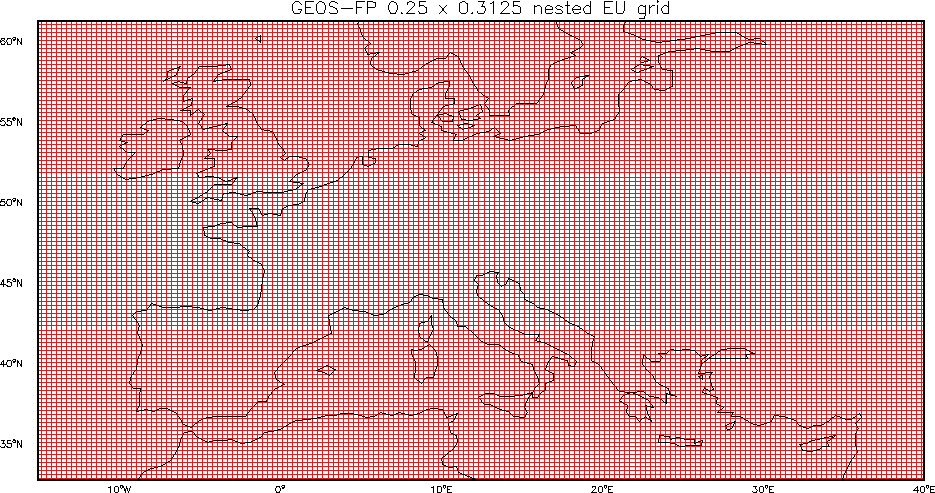
| 23:10, 6 December 2016 | GEOSFP 025x03125 EU.png (file) |  |
9 KB | Melissa Payer | GEOS-FP 0.25 x 0.3125 nested EU grid | 1 |
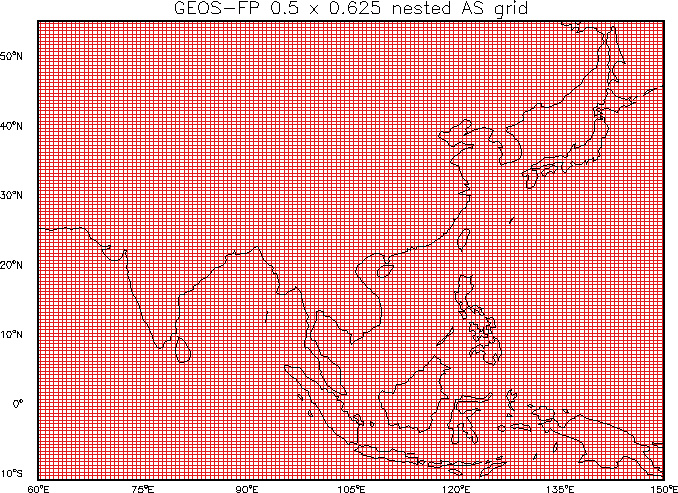
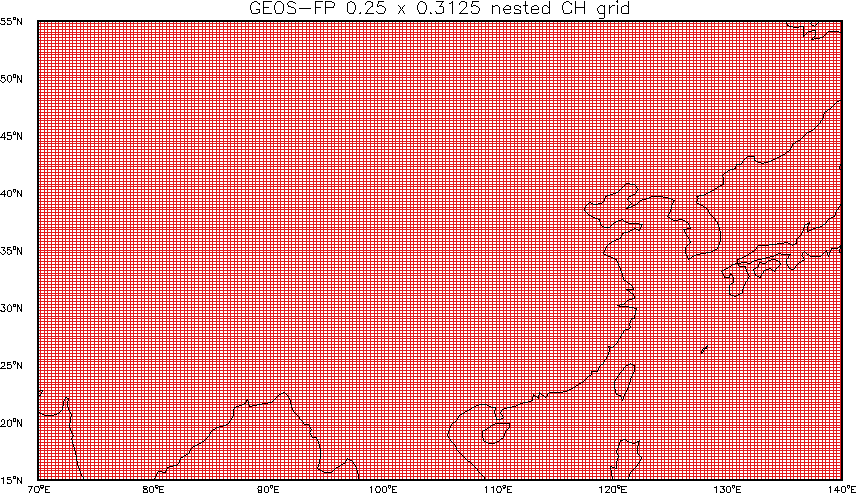
| 23:10, 6 December 2016 | GEOSFP 025x03125 CH.png (file) |  |
6 KB | Melissa Payer | GEOS-FP 0.25 x 0.3125 nested CH grid | 1 |
| 16:21, 2 December 2016 | Obsolete.jpg (file) |  |
39 KB | Bmy | Obsolete jpg | 1 |
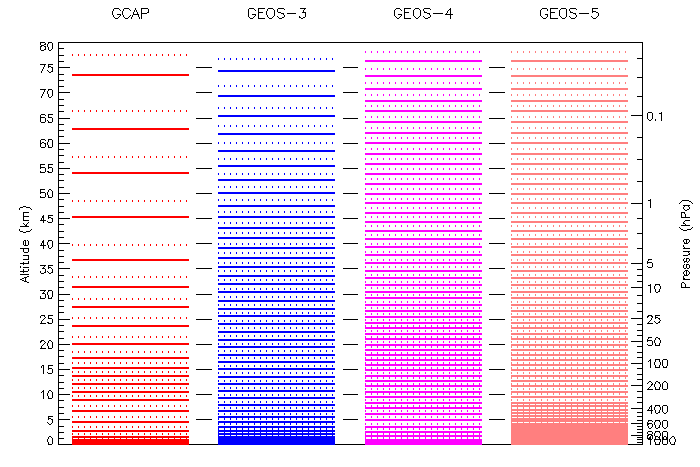
| 20:32, 14 November 2016 | Levels80km.png (file) |  |
9 KB | Bmy | Comparison of vertical levels up to 80km | 1 |
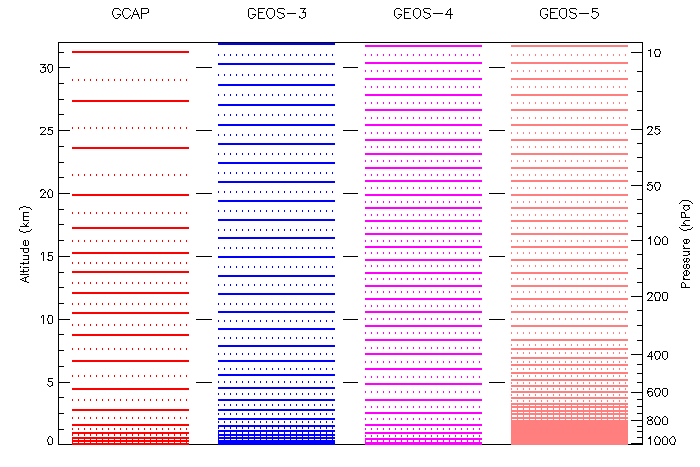
| 20:32, 14 November 2016 | Levels32km.png (file) |  |
7 KB | Bmy | Comparison of vertical levels up to 32 km | 1 |
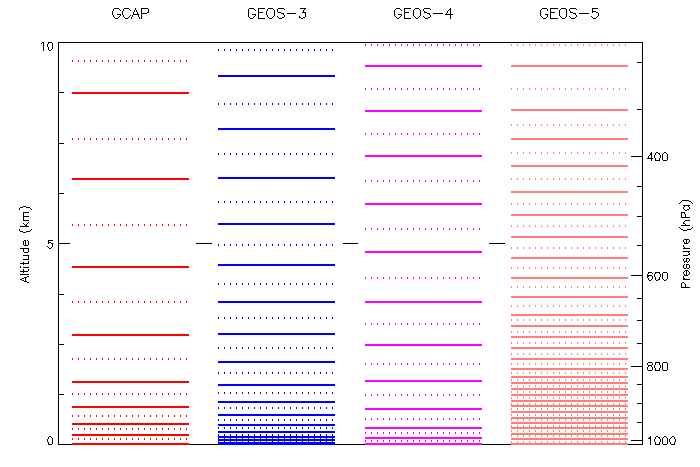
| 20:31, 14 November 2016 | Levels10km.png (file) |  |
6 KB | Bmy | Comparison of vertical levels up to 10km | 1 |
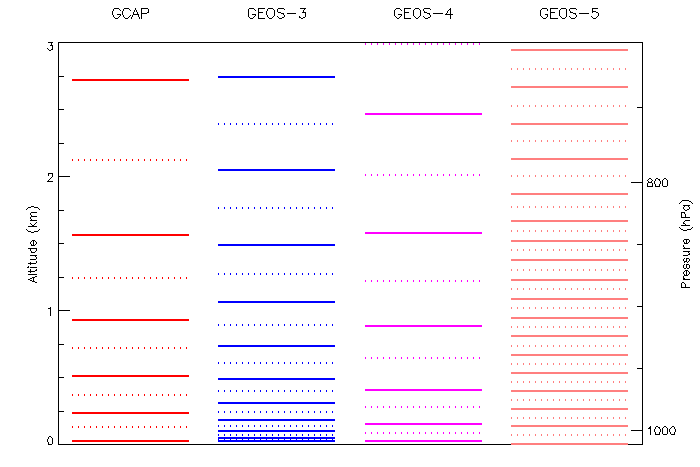
| 20:31, 14 November 2016 | Levels3km.png (file) |  |
5 KB | Bmy | Comparison of vertical levels up to 3km | 1 |
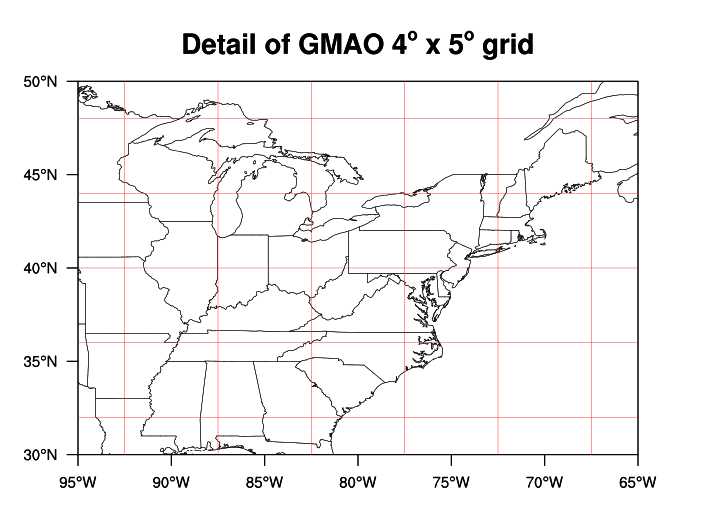
| 22:36, 10 November 2016 | Grid gmao4x5.png (file) |  |
59 KB | Bmy | GMAO 4 x 5 grid | 1 |
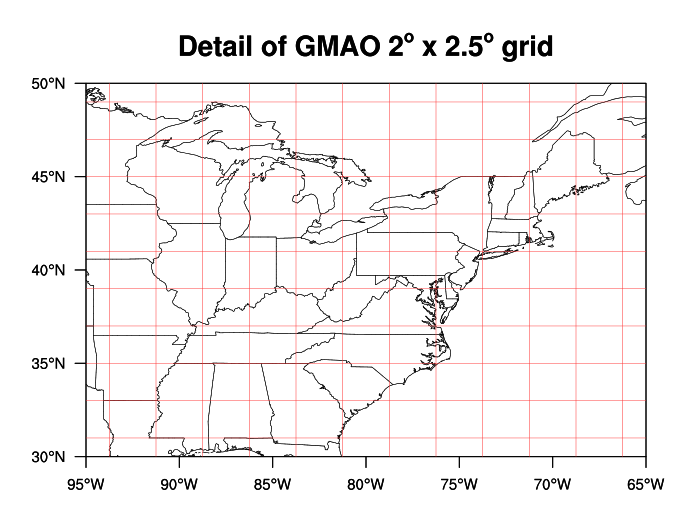
| 22:36, 10 November 2016 | Grid gmao2x25.png (file) |  |
64 KB | Bmy | GMAO 2 x 2.5 grid | 1 |
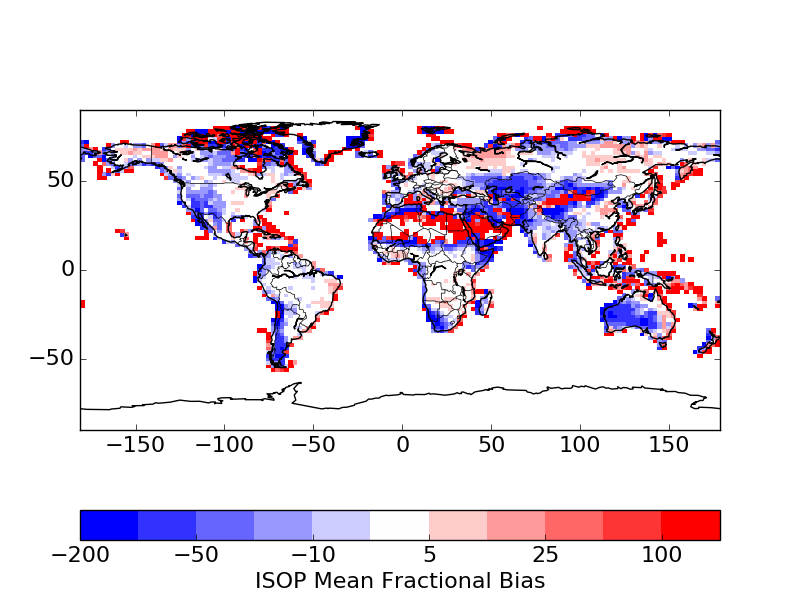
| 18:58, 4 November 2016 | MFB LAI 2010.png (file) |  |
119 KB | Barronh | Mean fractional bias between standard GEOS-Chem ISOP emissions and new Yuan product. | 1 |
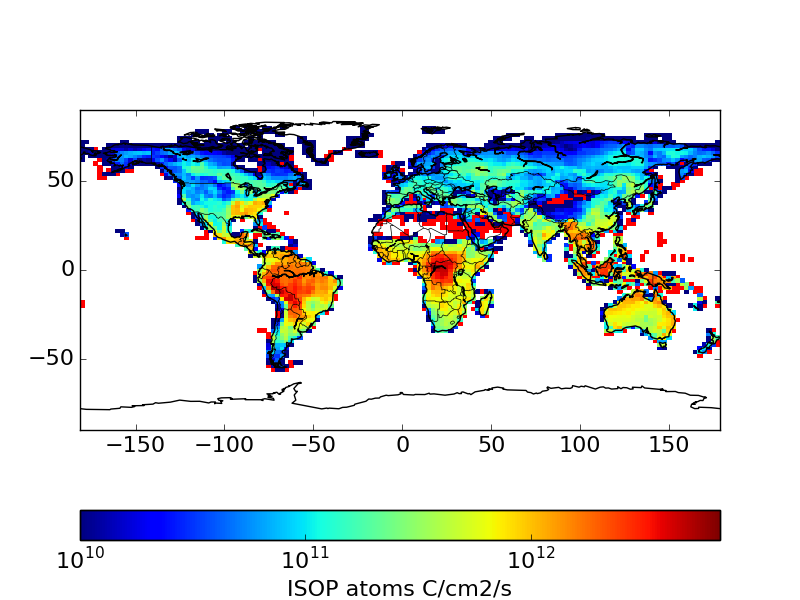
| 18:58, 4 November 2016 | STD LAI 2010.png (file) |  |
108 KB | Barronh | 1 | |
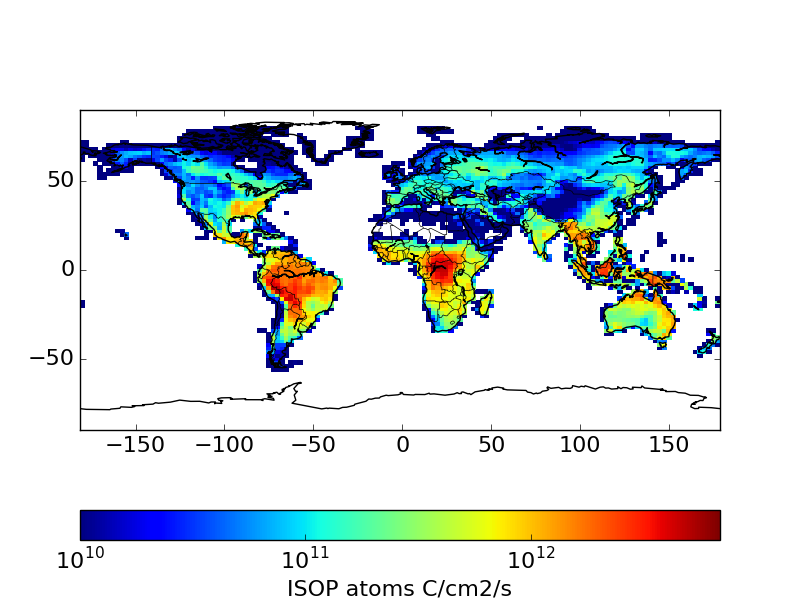
| 18:56, 4 November 2016 | BNU LAI 2010.png (file) |  |
106 KB | Barronh | 1 |
First page |
Previous page |
Next page |
Last page |