File list
This special page shows all uploaded files.
First page |
Previous page |
Next page |
Last page |
| Date | Name | Thumbnail | Size | Description | Versions |
|---|---|---|---|---|---|
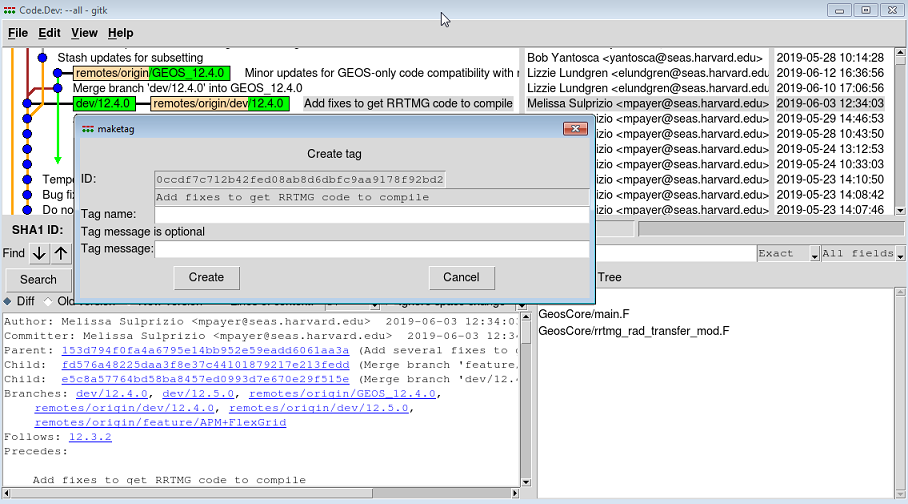
| 16:27, 20 June 2019 | GitKCreateTag.png (file) |  |
157 KB | GitK demo -- create tag | 1 |
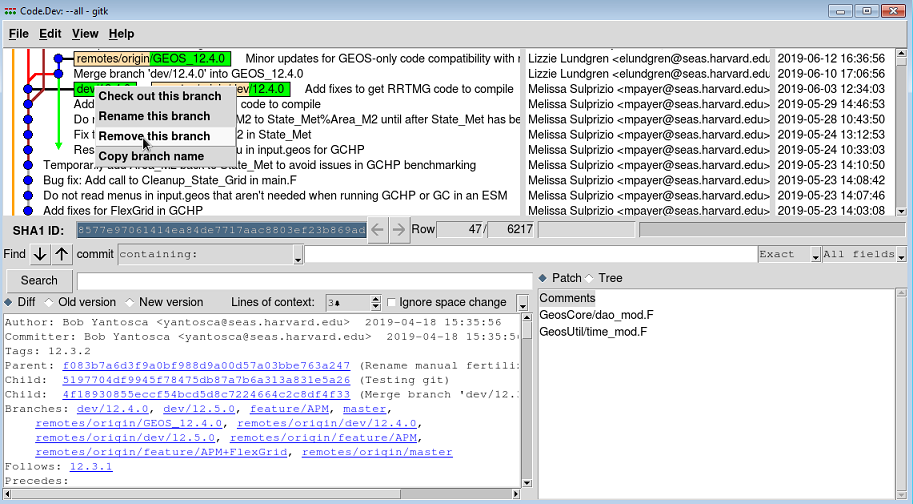
| 16:05, 20 June 2019 | GitKDeleteBranch.png (file) |  |
191 KB | GitK demo -- delete branch | 1 |
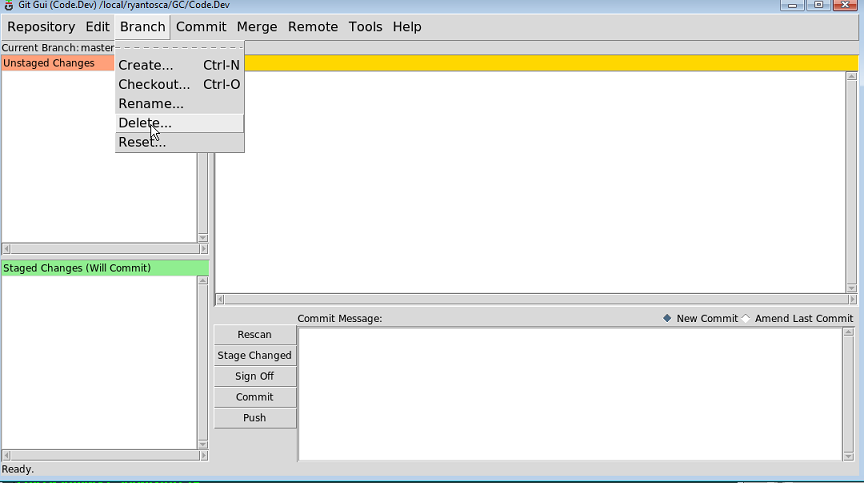
| 16:02, 20 June 2019 | GitGuiDeleteBranch.png (file) |  |
53 KB | Git GUI demo -- delete branch | 1 |
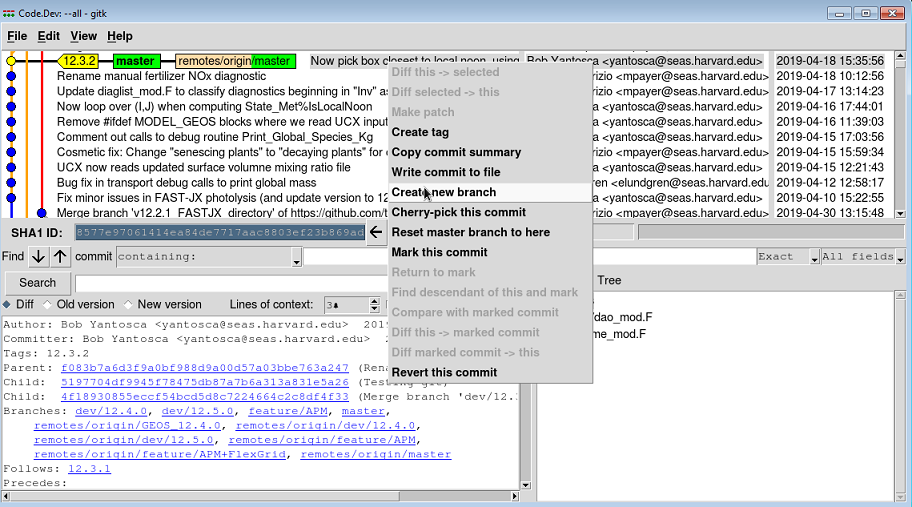
| 15:07, 20 June 2019 | GitkNewBranch.png (file) |  |
196 KB | GitK demo -- new branch | 1 |
| 15:07, 20 June 2019 | GitKCreateBranch.png (file) |  |
169 KB | GitK demo -- create branch box | 1 |
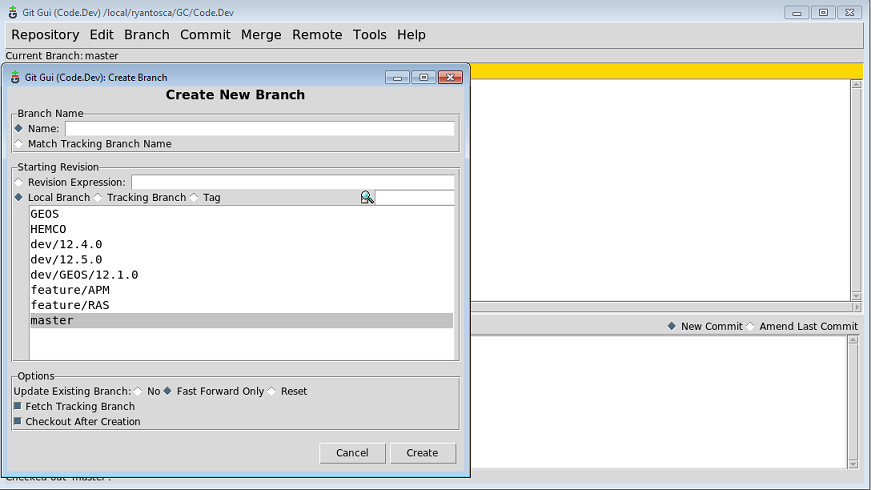
| 14:59, 20 June 2019 | GitGuiNewBranch.png (file) |  |
80 KB | Git Gui demo -- new branch menu | 1 |
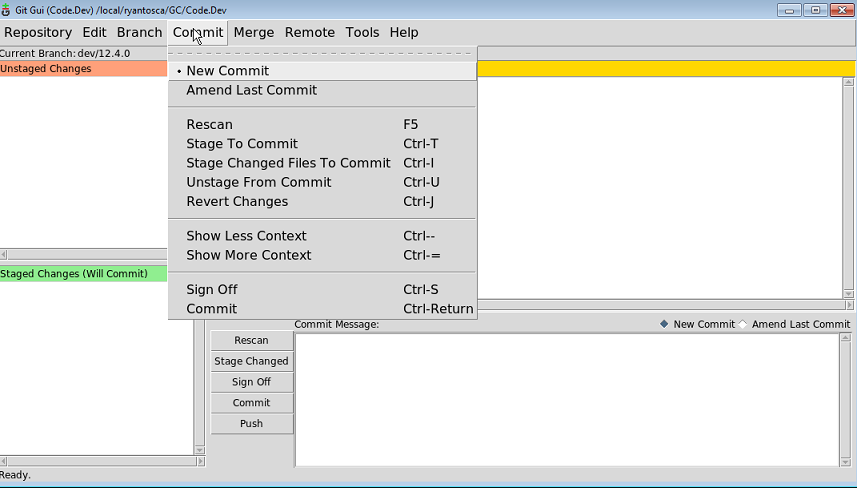
| 21:21, 19 June 2019 | GitGuiCommitMenu.png (file) |  |
77 KB | Git Gui demo -- commit menu | 1 |
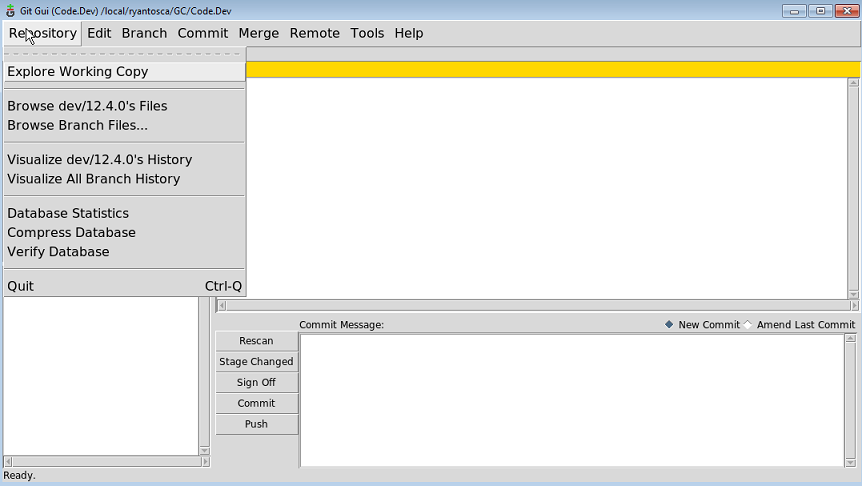
| 21:18, 19 June 2019 | GitGuiRepoMenu.png (file) |  |
64 KB | Git Gui demo -- Repo menu | 1 |
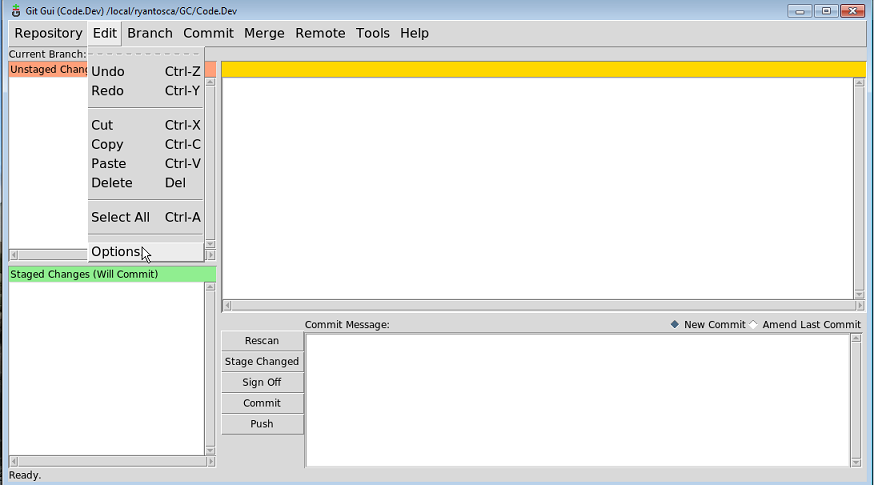
| 21:18, 19 June 2019 | GitGuiEditMenu.png (file) |  |
66 KB | Git Gui menu -- Edit menu | 1 |
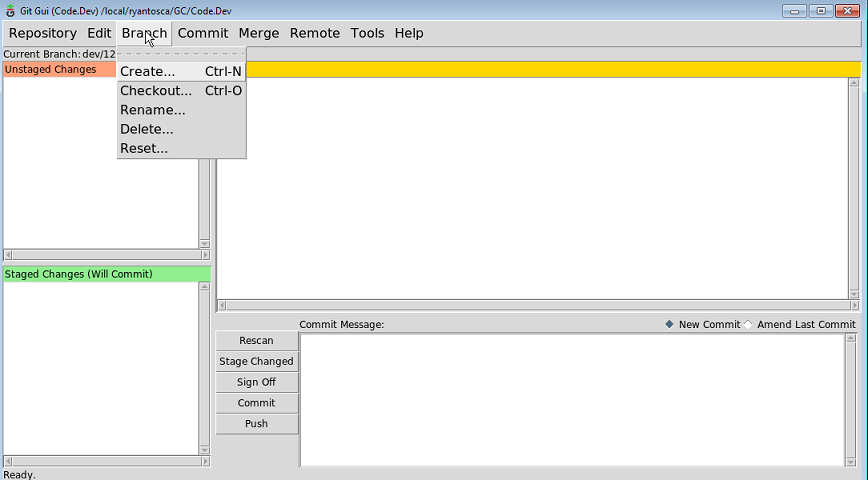
| 21:17, 19 June 2019 | GitGuiBranchMenu.png (file) |  |
57 KB | Git Gui demo -- Branch menu | 1 |
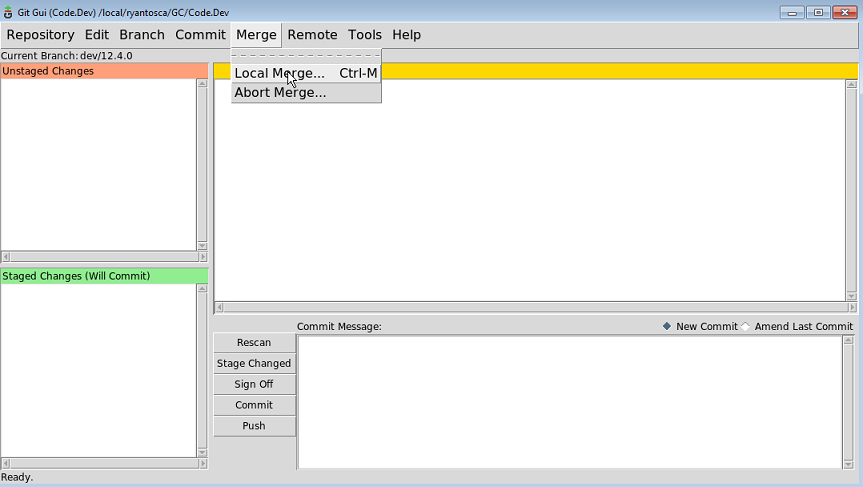
| 21:16, 19 June 2019 | GitGuiMergeMenu.png (file) |  |
53 KB | Git Gui demo --merge menu | 1 |
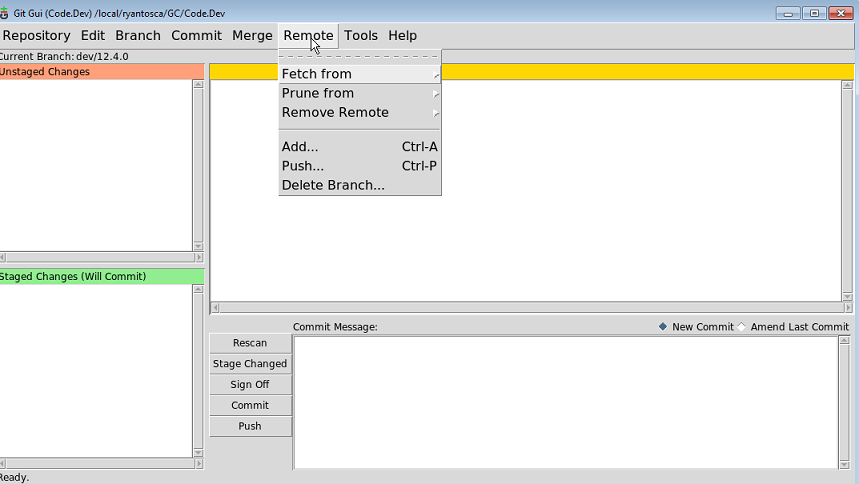
| 21:16, 19 June 2019 | GitGuiRemoteMenu.png (file) |  |
59 KB | Git Gui demo -- remote menu | 1 |
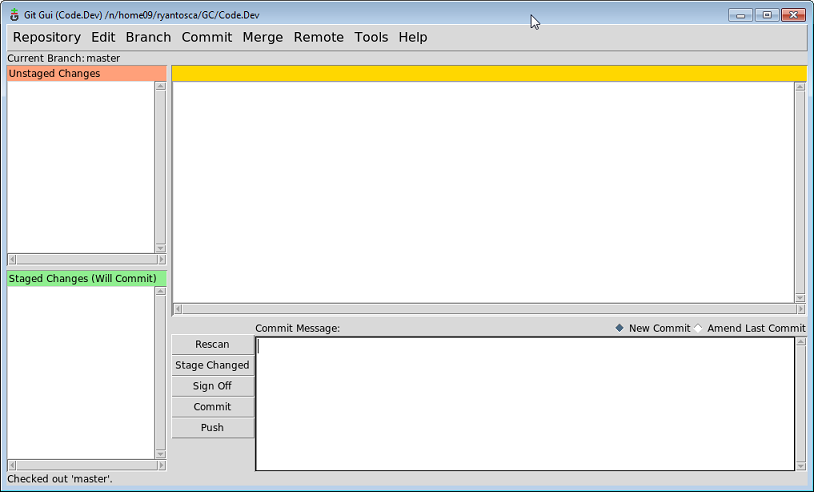
| 15:52, 19 June 2019 | GitGui.png (file) |  |
50 KB | Example of Git Gui | 1 |
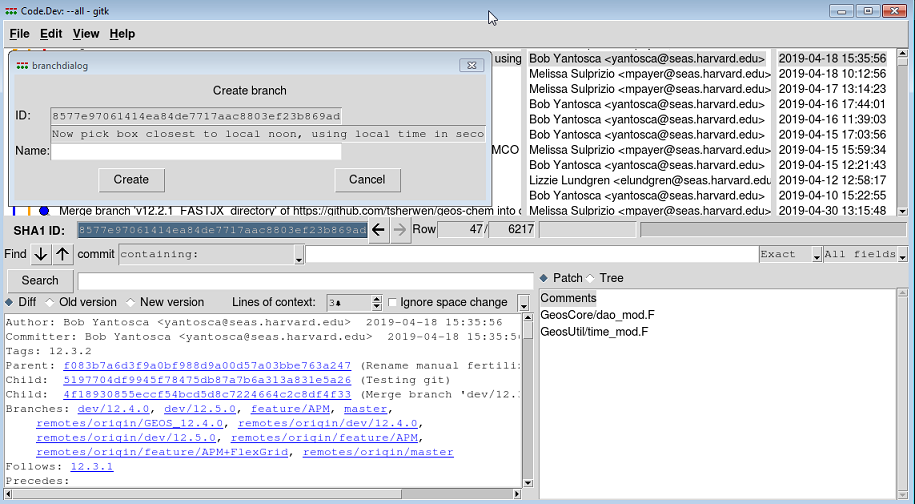
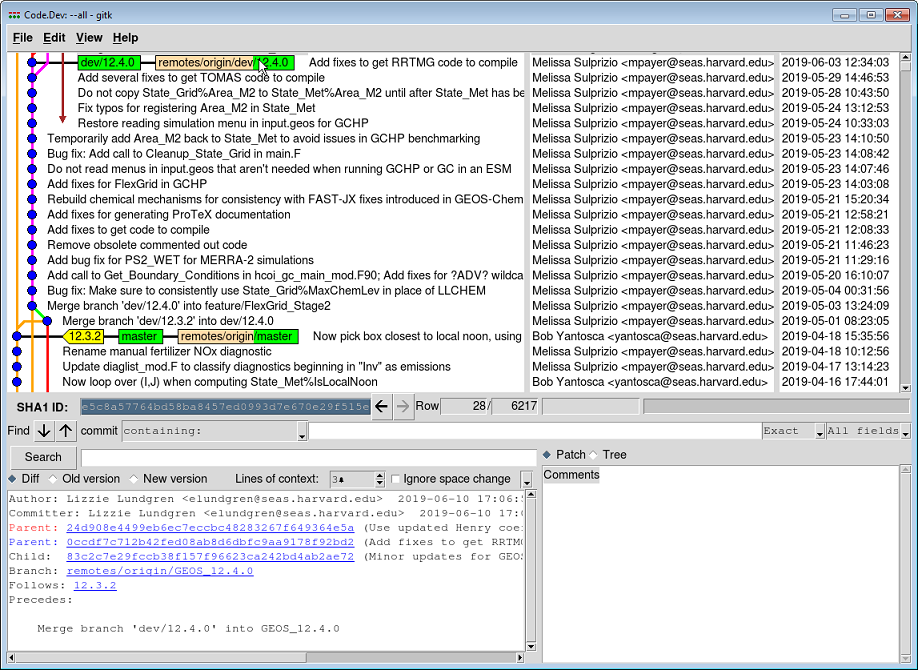
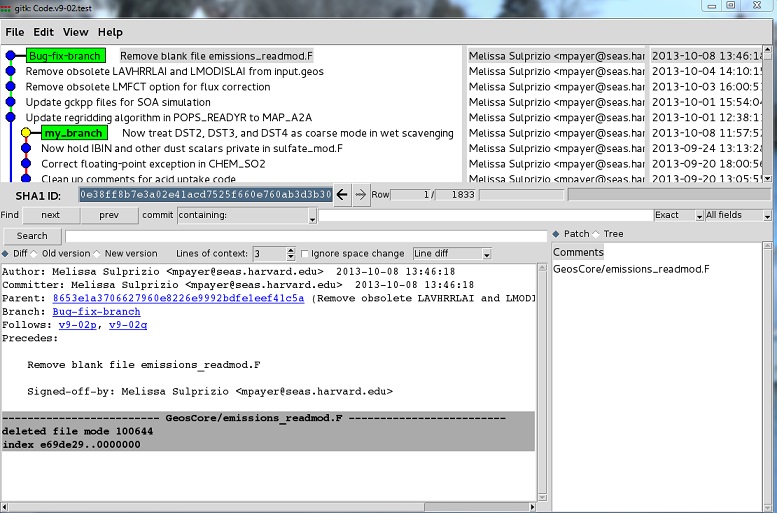
| 15:52, 19 June 2019 | Gitk.png (file) |  |
281 KB | Gitk example | 1 |
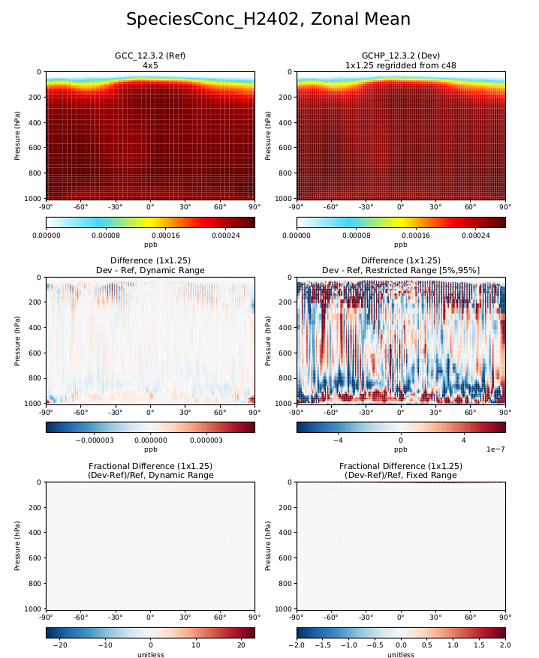
| 18:34, 16 April 2019 | H2402 issue resolved.png (file) |  |
275 KB | Plot of H2402 using a new input file that resolves a prior issue. | 1 |
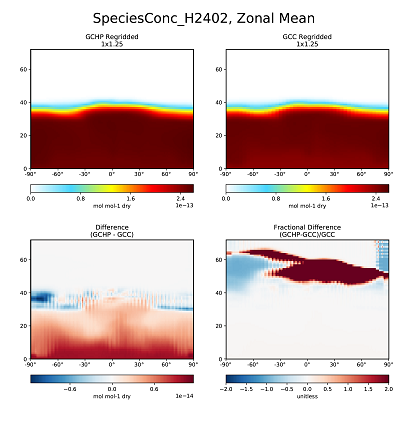
| 19:57, 7 December 2018 | H2402 issue.png (file) |  |
80 KB | Shows issue with H2402 | 1 |
| 16:29, 27 August 2018 | Travis ci.png (file) |  |
12 KB | Sample of Github commit with green checkmark | 1 |
| 20:30, 16 August 2018 | GEOS-Chem 12.0.0 timing results.pdf (file) | 1.69 MB | PDF with a complete description of the 12.0.0 timing results | 1 | |
| 15:07, 24 February 2017 | Mass cons prec8 1yr vdiff.png (file) |  |
45 KB | Evolution of tracer mass vs. time for a geosfp_2x25_masscons simulation (year 2013) with PRECISION=8 and VDIFF PBL mixing. | 1 |
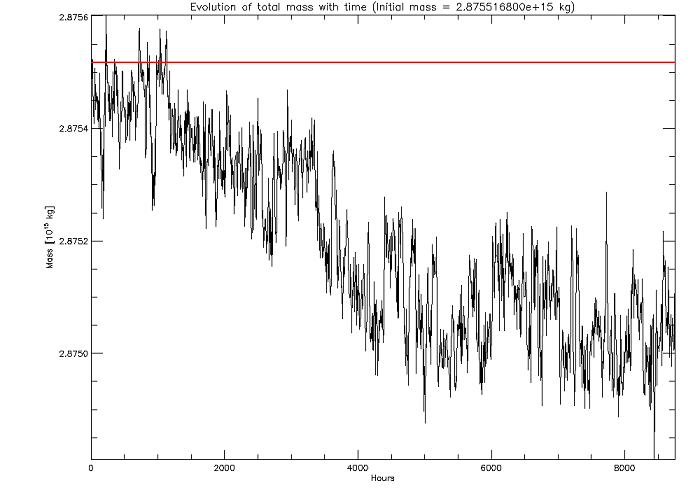
| 15:07, 24 February 2017 | Mass cons prec4 1yr vdiff.png (file) |  |
43 KB | Evolution of tracer mass vs. time for a geosfp_2x25_masscons simulation (year 2013) with PRECISION=4 and VDIFF PBL mixing. | 1 |
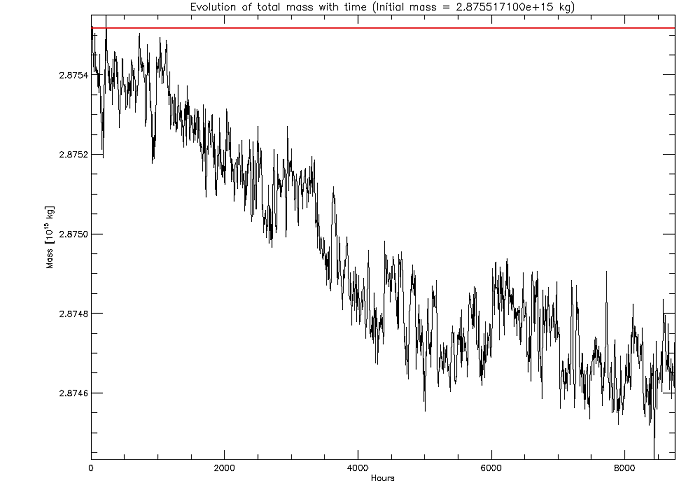
| 20:53, 23 February 2017 | Mass cons prec4 1yr.png (file) |  |
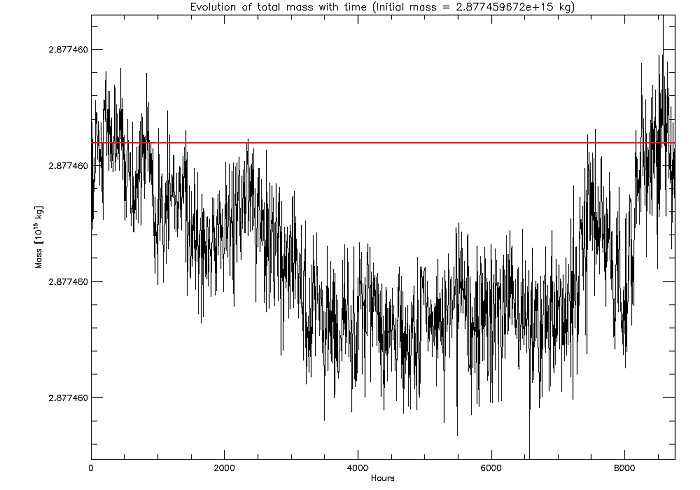
43 KB | Evolution of tracer mass with time from a geosfp_2x25_masscons simulation for 2013. | 1 |
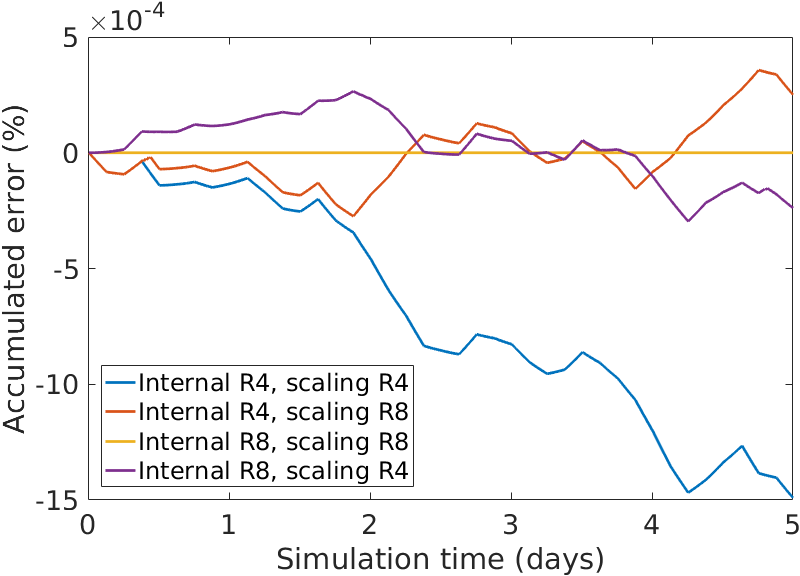
| 19:33, 23 February 2017 | Transport error v3 gchp.png (file) | 50 KB | Shows transport error using various combinations of flexible precision in GCHP. | 1 | |
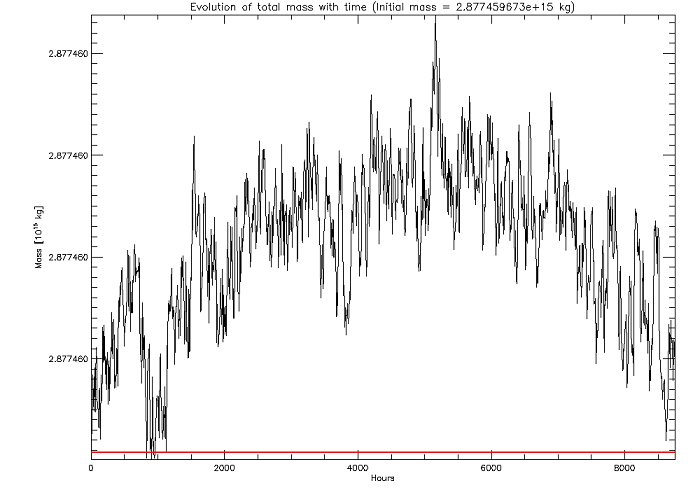
| 21:54, 22 February 2017 | Mass cons prec8 1yr.png (file) |  |
46 KB | Evolution of tracer mass with time from a geosfp_2x25_masscons simulation using PRECISION=8 and TURBDAY PBL mixing for 2013. | 1 |
| 18:18, 17 February 2017 | Depvel figure 3.png (file) |  |
39 KB | Figure #3 from Brian Boys | 1 |
| 18:18, 17 February 2017 | Depvel figure 2.png (file) |  |
40 KB | Figure #2 from Brian Boys | 1 |
| 18:18, 17 February 2017 | Depvel figure 1.png (file) |  |
30 KB | Figure # 1 from Brian Boys (smaller) | 1 |
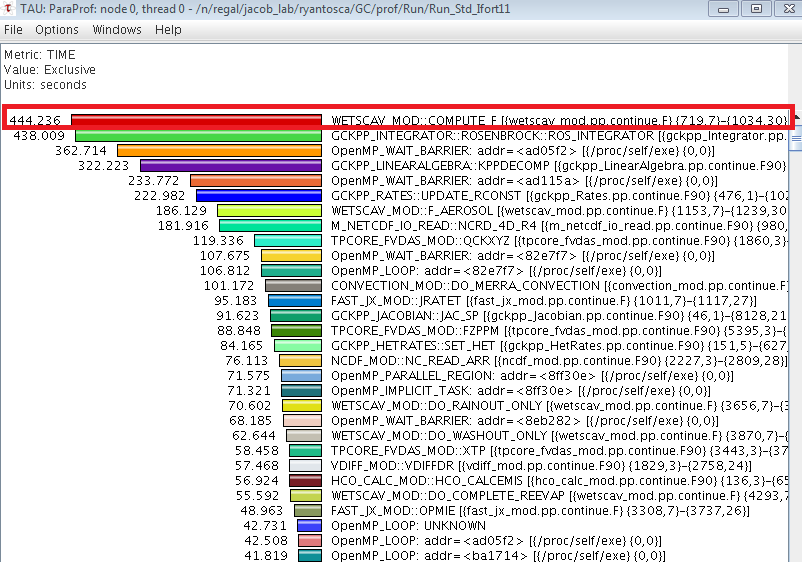
| 21:43, 8 February 2017 | V11-01-thread0.png (file) |  |
48 KB | Profiling plot from TAU showing bottleneck in v11-01 convection module | 1 |
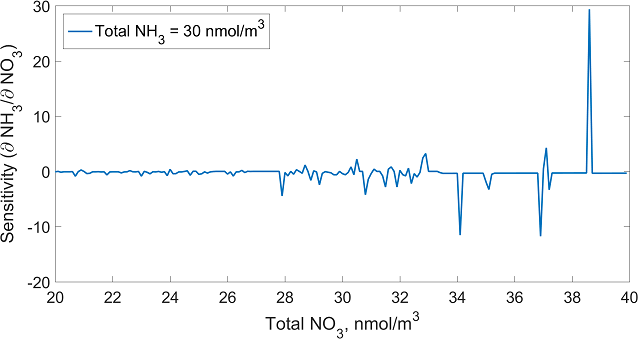
| 20:55, 23 January 2017 | ISORROPIASensitivity.png (file) |  |
31 KB | Sensitivity of gas-phase NO3 to total NO3, by Seb Eastham | 1 |
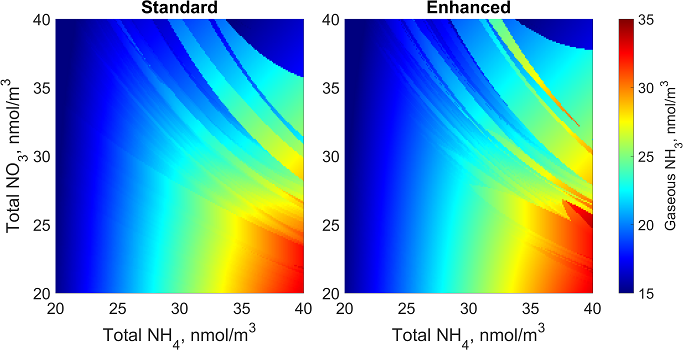
| 20:54, 23 January 2017 | ISORROPIAAnalysisSingle.png (file) |  |
149 KB | Detail of nonconvergence regions by Seb Eastham | 1 |
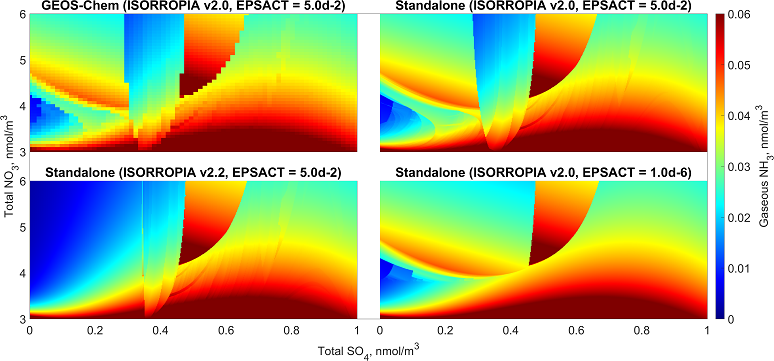
| 20:54, 23 January 2017 | ISORROPIAAnalysis.png (file) |  |
166 KB | Parameter sweeps with ISORROPIA by Seb Eastham | 1 |
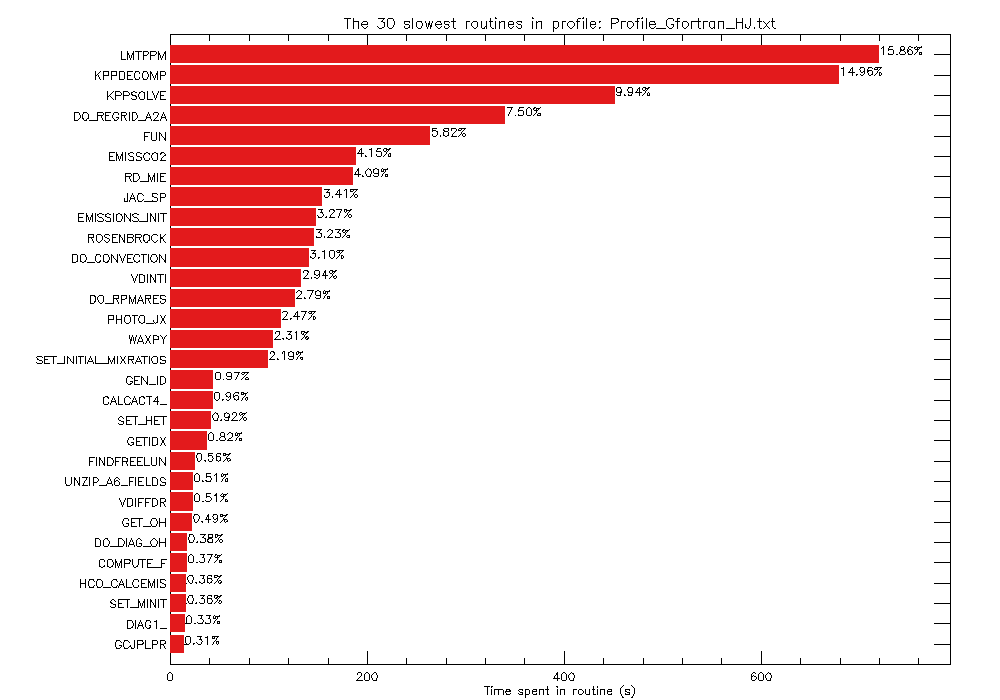
| 20:18, 15 December 2016 | Plot gprof output.png (file) |  |
14 KB | Example plot from the GAMAP "plot_gprof.pro" routine. | 1 |
| 16:21, 2 December 2016 | Obsolete.jpg (file) |  |
39 KB | Obsolete jpg | 1 |
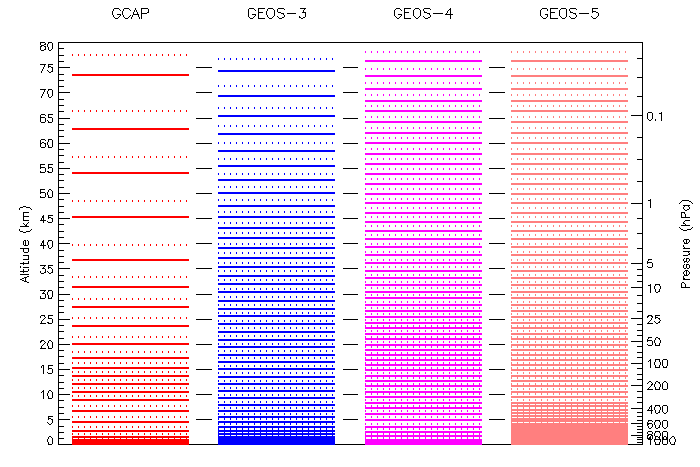
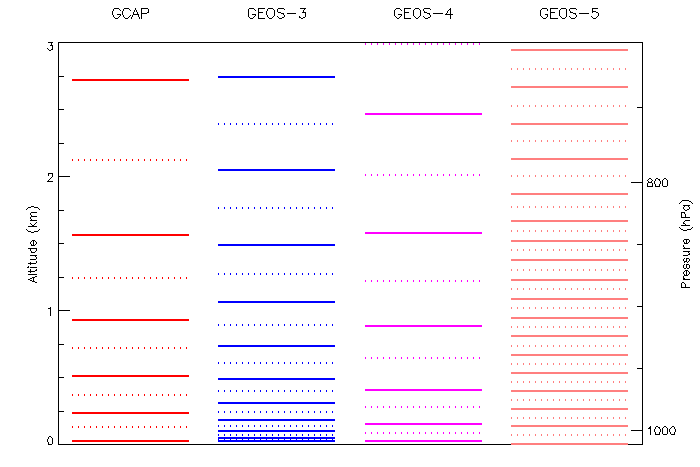
| 20:32, 14 November 2016 | Levels80km.png (file) |  |
9 KB | Comparison of vertical levels up to 80km | 1 |
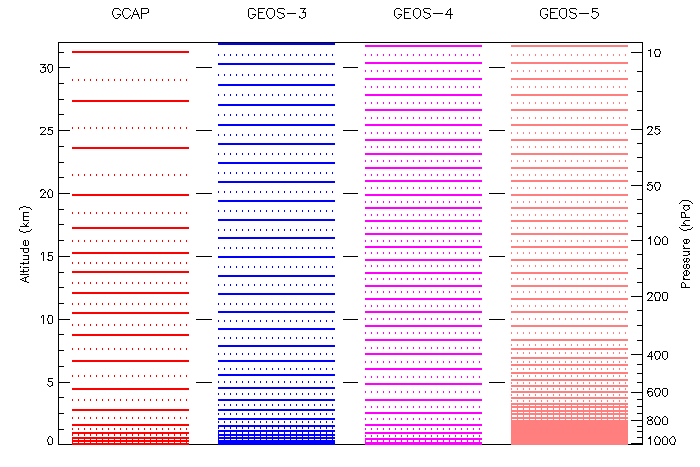
| 20:32, 14 November 2016 | Levels32km.png (file) |  |
7 KB | Comparison of vertical levels up to 32 km | 1 |
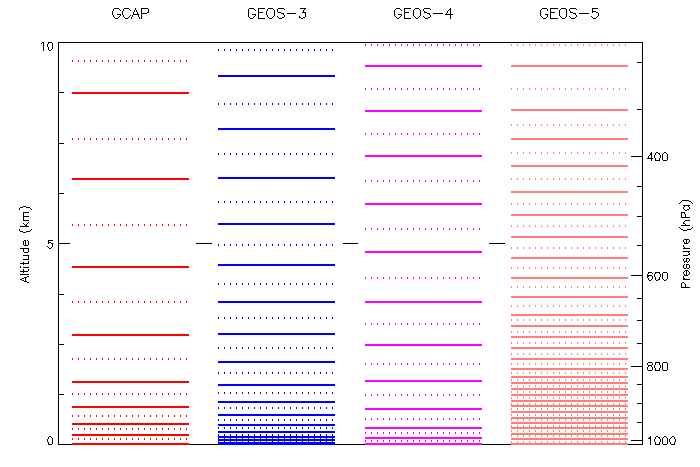
| 20:31, 14 November 2016 | Levels10km.png (file) |  |
6 KB | Comparison of vertical levels up to 10km | 1 |
| 20:31, 14 November 2016 | Levels3km.png (file) |  |
5 KB | Comparison of vertical levels up to 3km | 1 |
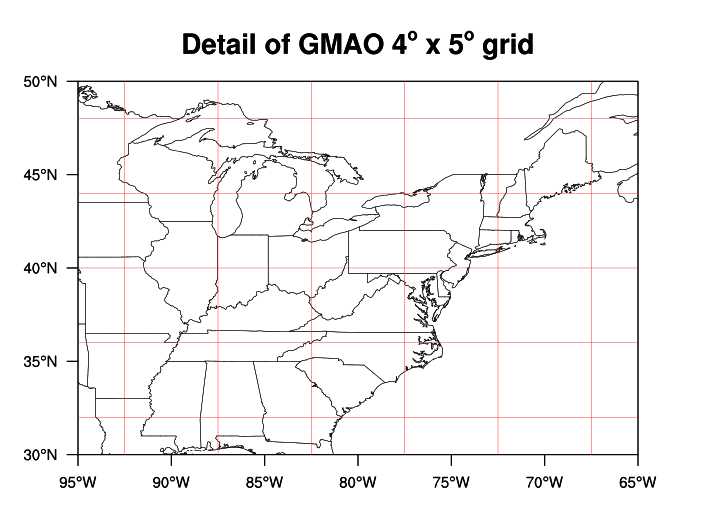
| 22:36, 10 November 2016 | Grid gmao4x5.png (file) |  |
59 KB | GMAO 4 x 5 grid | 1 |
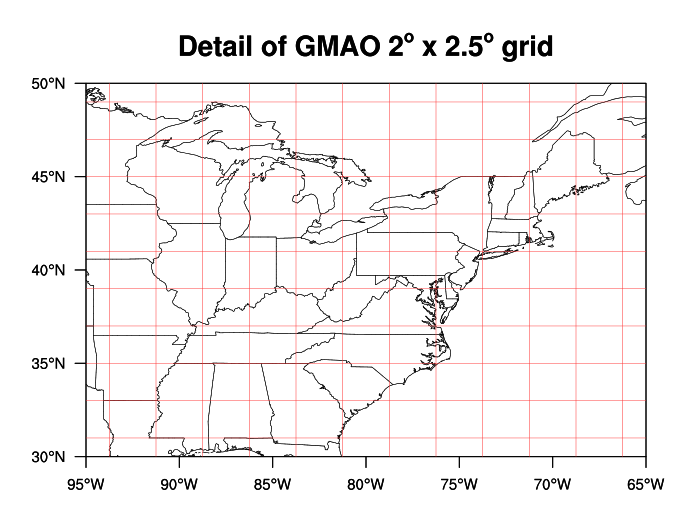
| 22:36, 10 November 2016 | Grid gmao2x25.png (file) |  |
64 KB | GMAO 2 x 2.5 grid | 1 |
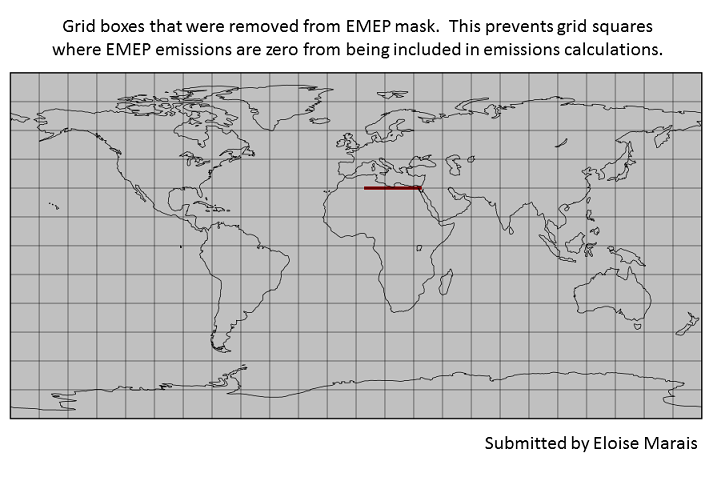
| 20:48, 6 January 2016 | Boxes removed from EMEP mask.png (file) |  |
97 KB | Shows the grid boxes removed from the EMEP mask. | 1 |
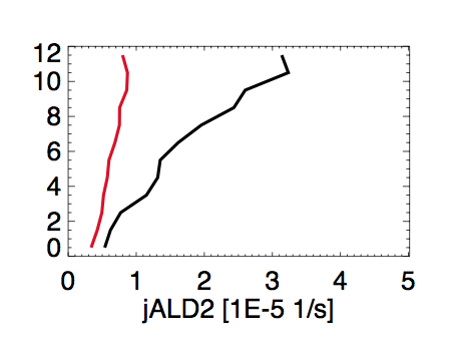
| 18:54, 27 May 2014 | ALD2 photolysis.png (file) |  |
34 KB | Plot made by Chris Chan Miller showing the discrepancy between observed and modeled J(ALD2). | 1 |
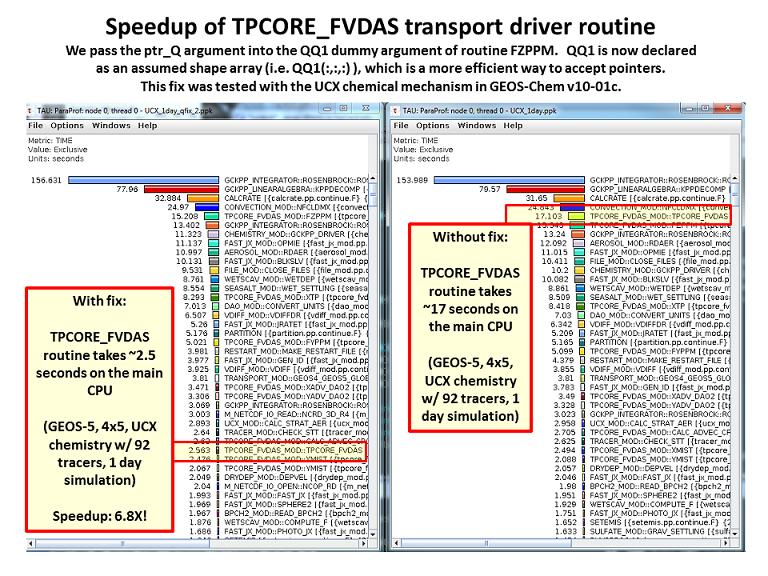
| 20:53, 16 April 2014 | TPCORE FVDAS Speedup.png (file) |  |
286 KB | Image illustrating the speedup obtained by passing ptr_Q pointer argument to an assumed-shape dummy argument qq1(:,:,:). | 1 |
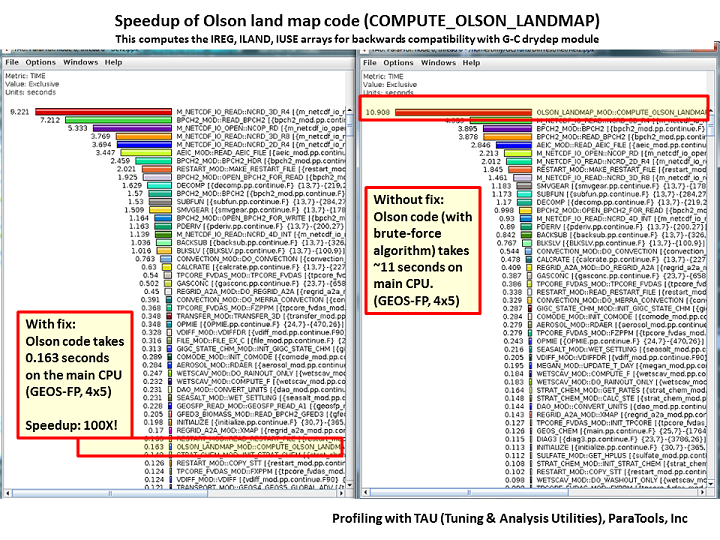
| 14:15, 21 March 2014 | Olson Speedup.png (file) |  |
287 KB | Demonstrates the speedup in the Olson landmap code. Visualization generated with the TAU profiler. | 1 |
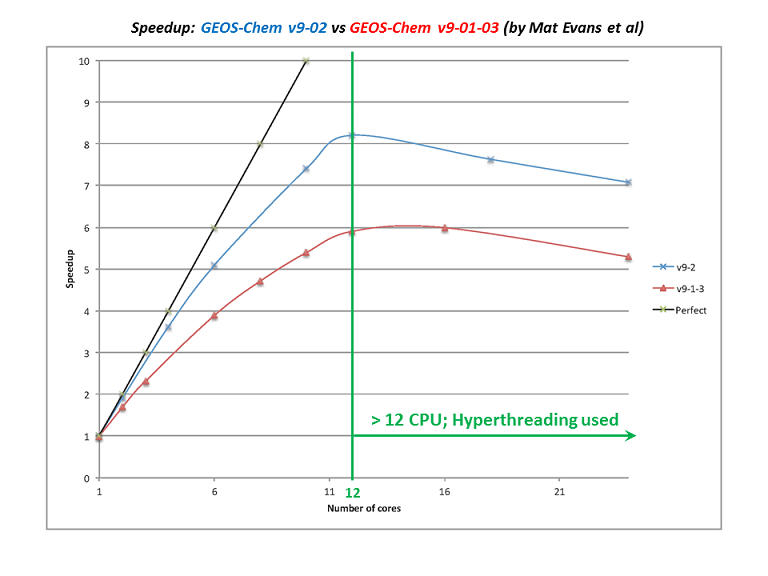
| 15:42, 19 November 2013 | Speedup v9-02.png (file) |  |
53 KB | Shows the speedup of GEOS-Chem v9-02 vs v9-01-03. | 1 |
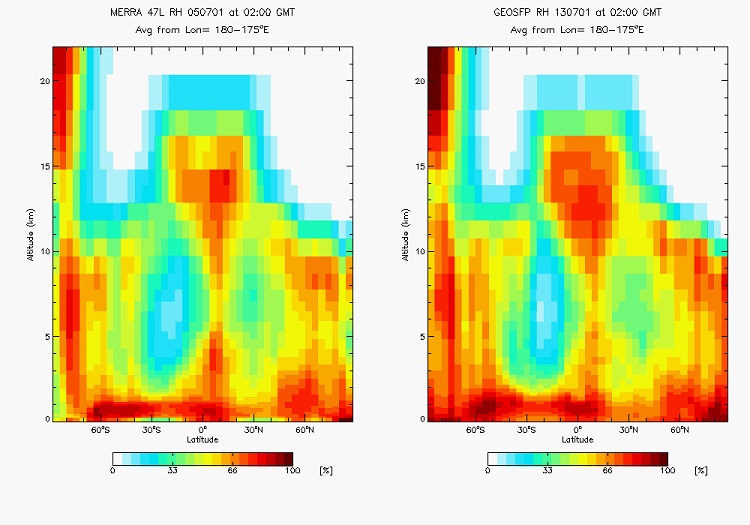
| 16:02, 15 November 2013 | Fixed rh.jpg (file) |  |
101 KB | Contains image showing fixed units of RH in GEOS-FP, MERRA | 1 |
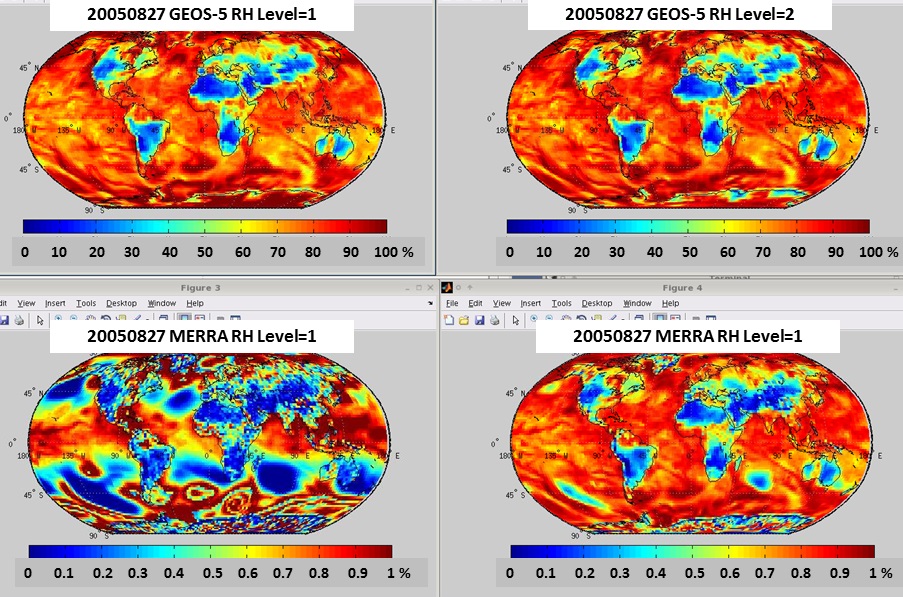
| 15:50, 15 November 2013 | MERRA RH avd.jpg (file) |  |
269 KB | Illustrates the problem of MERRA vs. GEOS-5 RH | 1 |
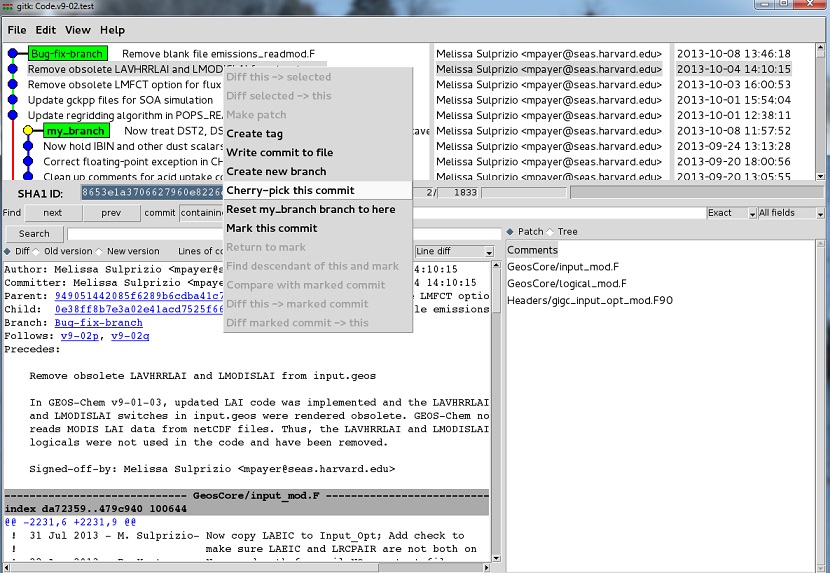
| 16:18, 11 October 2013 | Cherry pick 2.jpg (file) |  |
188 KB | Cherry-pick example #2 | 2 |
| 16:01, 11 October 2013 | Cherry pick 3.jpg (file) |  |
188 KB | Cherry pick example #3 | 1 |
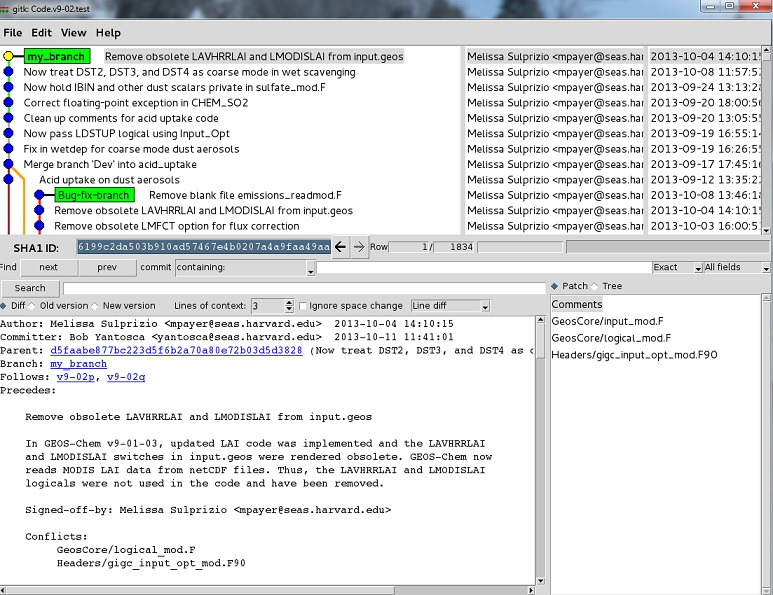
| 16:00, 11 October 2013 | Cherry pick 1.jpg (file) |  |
147 KB | Cherry pick example #1 | 1 |
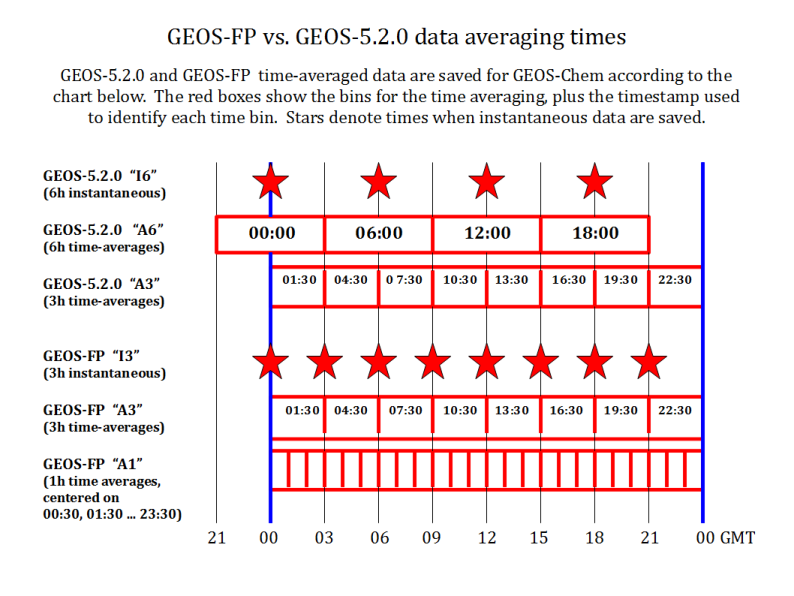
| 21:11, 16 August 2013 | GEOS FP vs GEOS 5 timing 794x596.png (file) |  |
147 KB | GEOS-FP vs. GEOS-5.2.0 met field file timestamps | 1 |
| 16:46, 10 July 2012 | V9-01-03o.compare.pdf (file) | 927 KB | Document from Lee Murray showing bromine concentration differences | 1 |
First page |
Previous page |
Next page |
Last page |