File list
This special page shows all uploaded files.
First page |
Previous page |
Next page |
Last page |
| Date | Name | Thumbnail | Size | User | Description | Versions |
|---|---|---|---|---|---|---|
| 22:06, 5 August 2013 | RnPbBe nonlocalPBL.pdf (file) | 822 KB | Melissa Payer | Plots comparing the Rn-Pb-Be simulation with and without non-local PBL mixing. Comparisons were provided by Karen Yu. | 1 | |
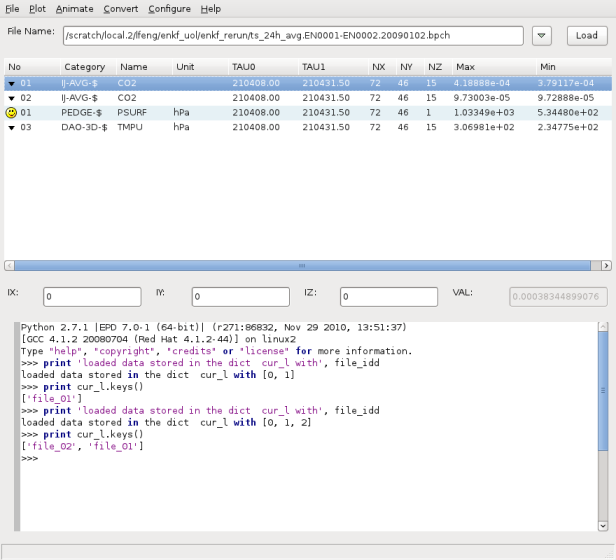
| 15:38, 28 May 2013 | Bpchdump gui.png (file) |  |
60 KB | Bmy | 2 | |
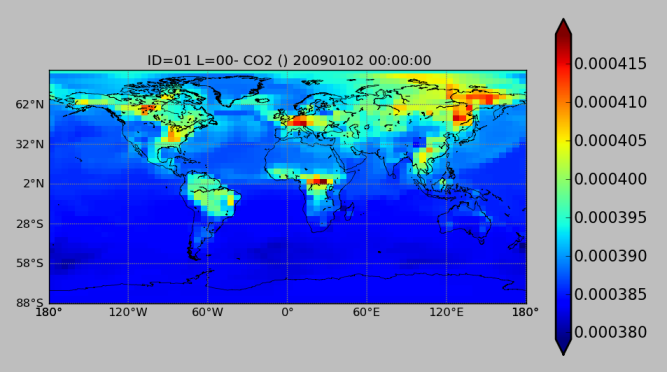
| 15:35, 28 May 2013 | Bpchdump plot.png (file) |  |
121 KB | Bmy | 1 | |
| 02:21, 16 May 2013 | AddingPassiveTracers.pdf (file) | 105 KB | Jaf | Description of steps required to add passive CO-like tracers to GEOS-Chem. | 1 | |
| 21:26, 14 May 2013 | IPR 20130513.pdf (file) | 84 KB | Helen Amos | Description of in-plume reduction and its implementation in the GEOS-Chem Hg simulation | 1 | |
| 19:49, 9 April 2013 | Patch GC-Hg.v9-01-03.txt (file) | 130 KB | Chris Holmes | Patch for GEOS-Chem v9-01-03 Hg simulation. GAMAP cannot read model output (ctm.bpch) without this patch. | 1 | |
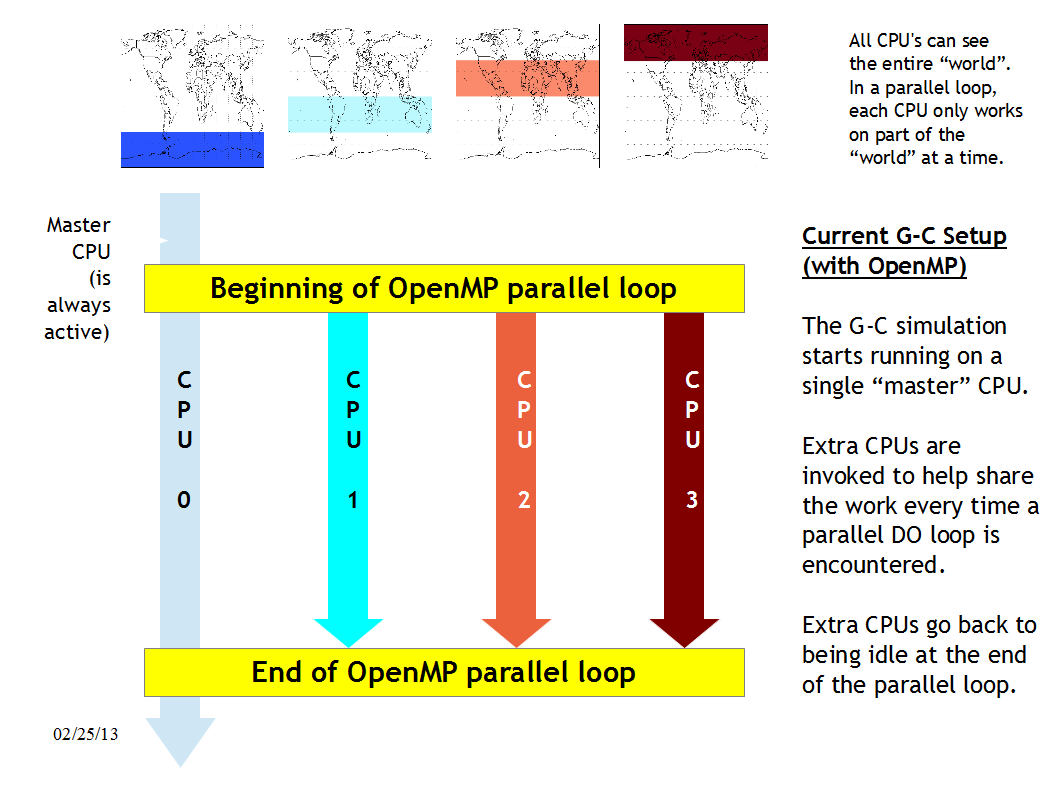
| 16:43, 25 February 2013 | OpenMP Demo.png (file) |  |
119 KB | Bmy | Demo of how OPENMP parallelization works. | 1 |
| 04:47, 19 February 2013 | FigureA.jpg (file) |  |
65 KB | Sajeev Philip | 1 | |
| 15:54, 24 January 2013 | Readme megan21.pdf (file) | 58 KB | Dbm | 2 | ||
| 15:52, 24 January 2013 | EmissComp 2011 05x067 NA.pdf (file) | 9.21 MB | Dbm | 1 | ||
| 19:07, 22 January 2013 | EmissAll 2x25.pdf (file) | 4.9 MB | Dbm | 1 | ||
| 19:06, 22 January 2013 | COComp 2006 4x5.pdf (file) | 3.94 MB | Dbm | 1 | ||
| 19:06, 22 January 2013 | EmissComp 2006 4x5.pdf (file) | 8.39 MB | Dbm | 1 | ||
| 19:05, 22 January 2013 | EmissComp 2006 2x25.pdf (file) | 9.07 MB | Dbm | 1 | ||
| 18:17, 19 December 2012 | GEOS changes MPN chemistry.pdf (file) | 55 KB | Melissa Payer | 1 | ||
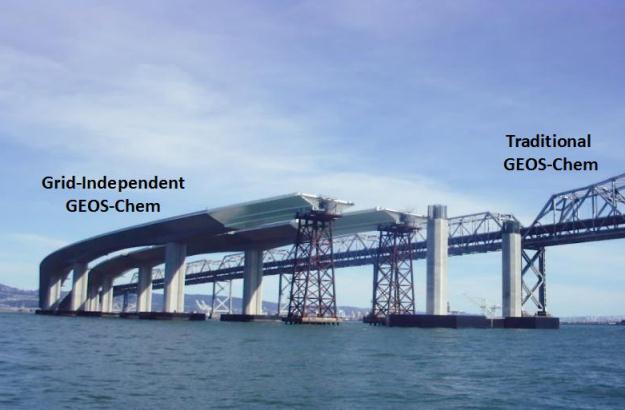
| 16:58, 14 December 2012 | GIGC Bridge.jpg (file) |  |
31 KB | Bmy | Diagram showing how we are building the new bridge (GIGC) next to the old bridge (existing GC). | 1 |
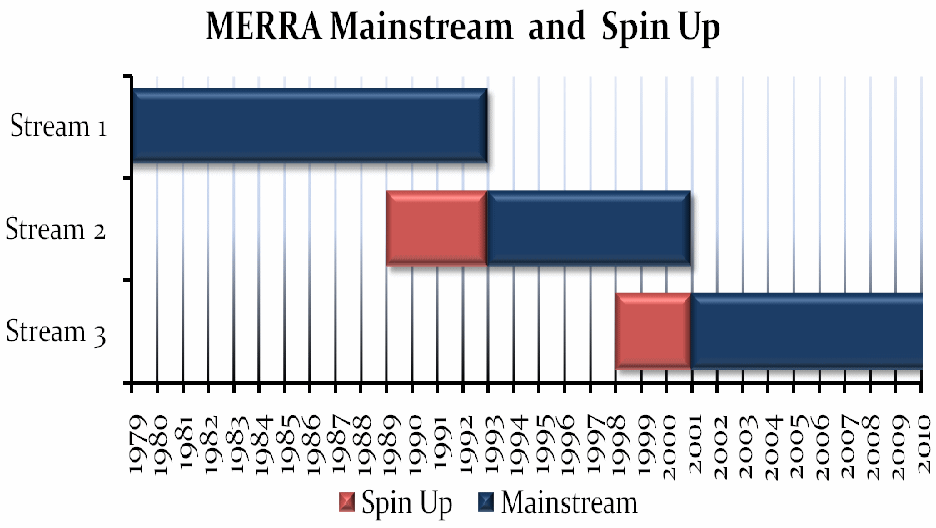
| 14:24, 23 July 2012 | MERRA availability png.png (file) |  |
55 KB | Bmy | Plot showing the years for which MERRA is available | 1 |
| 17:02, 18 July 2012 | Gc emissions type.pdf (file) | 83 KB | Bmy | Christoph Keller's slide about the linked-list data structure | 1 | |
| 00:09, 12 July 2012 | V9-01-03o.benchmark.vs.GMI.pdf (file) | 1.26 MB | Ltmurray | Comparison of v9-01-03n, v9-01-03o 1 month benchmarks zonal mean concentrations, and the climatological concentrations from the GMI Combo model from which the v9-01-03o prod/loss rates were derived. | 1 | |
| 16:46, 10 July 2012 | V9-01-03o.compare.pdf (file) | 927 KB | Bmy | Document from Lee Murray showing bromine concentration differences | 1 | |
| 06:31, 4 July 2012 | 2008 Arctas anthro v1.2 07222009.zip.txt (file) | 872 KB | Zuoshi | 1 | ||
| 15:37, 2 July 2012 | Sulfate mod.f.txt (file) | 315 KB | Meng Li | sulfate_mod.f | 1 | |
| 15:37, 2 July 2012 | Logical mod.f.txt (file) | 11 KB | Meng Li | logical_mod.f | 1 | |
| 15:37, 2 July 2012 | Input mod.f.txt (file) | 210 KB | Meng Li | input_mod.f | 1 | |
| 15:36, 2 July 2012 | Input.geos.txt (file) | 14 KB | Meng Li | input.geos | 1 | |
| 15:36, 2 July 2012 | Edgar mod.f.txt (file) | 113 KB | Meng Li | edgar_mod.f | 1 | |
| 15:35, 2 July 2012 | Biofuel mod.f.txt (file) | 53 KB | Meng Li | biofuel_mod.f | 1 | |
| 15:25, 2 July 2012 | Edgar mod.txt (file) | 113 KB | Meng Li | edgar_mod.f | 1 | |
| 15:20, 2 July 2012 | Biofuel mod.txt (file) | 53 KB | Meng Li | This is a fortran code | 1 | |
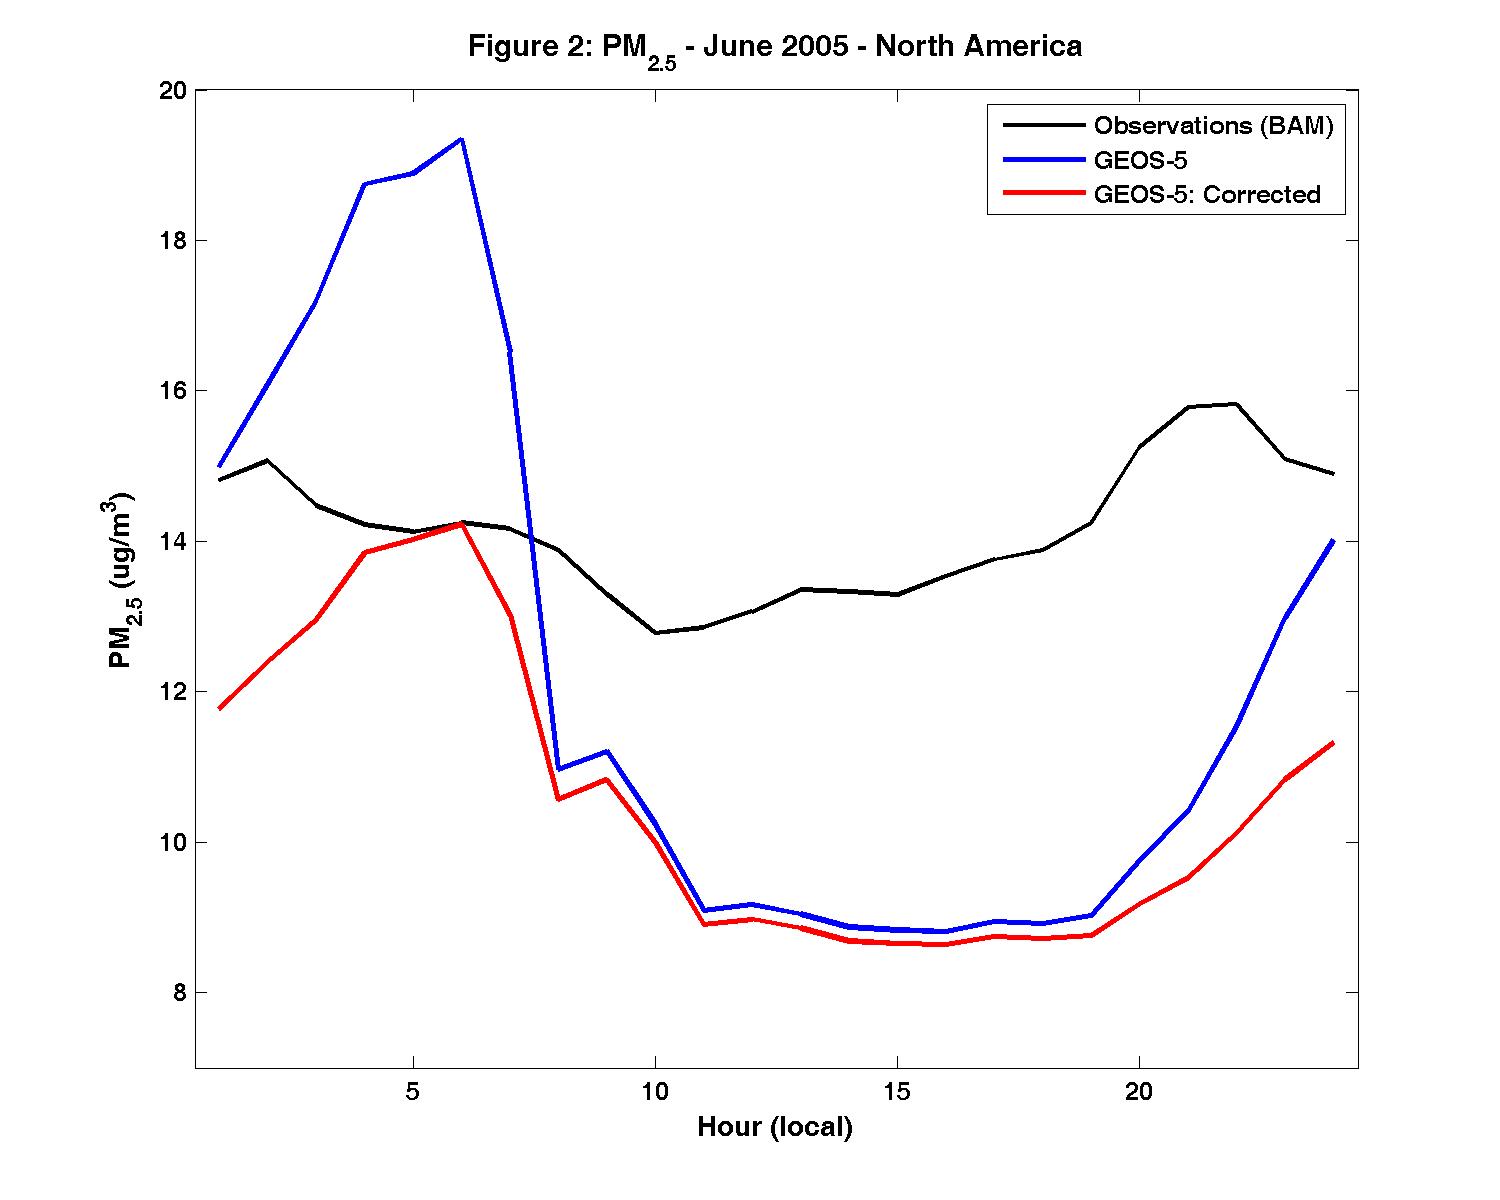
| 23:49, 19 June 2012 | Figure 2.jpg (file) |  |
98 KB | Sajeev Philip | 1 | |
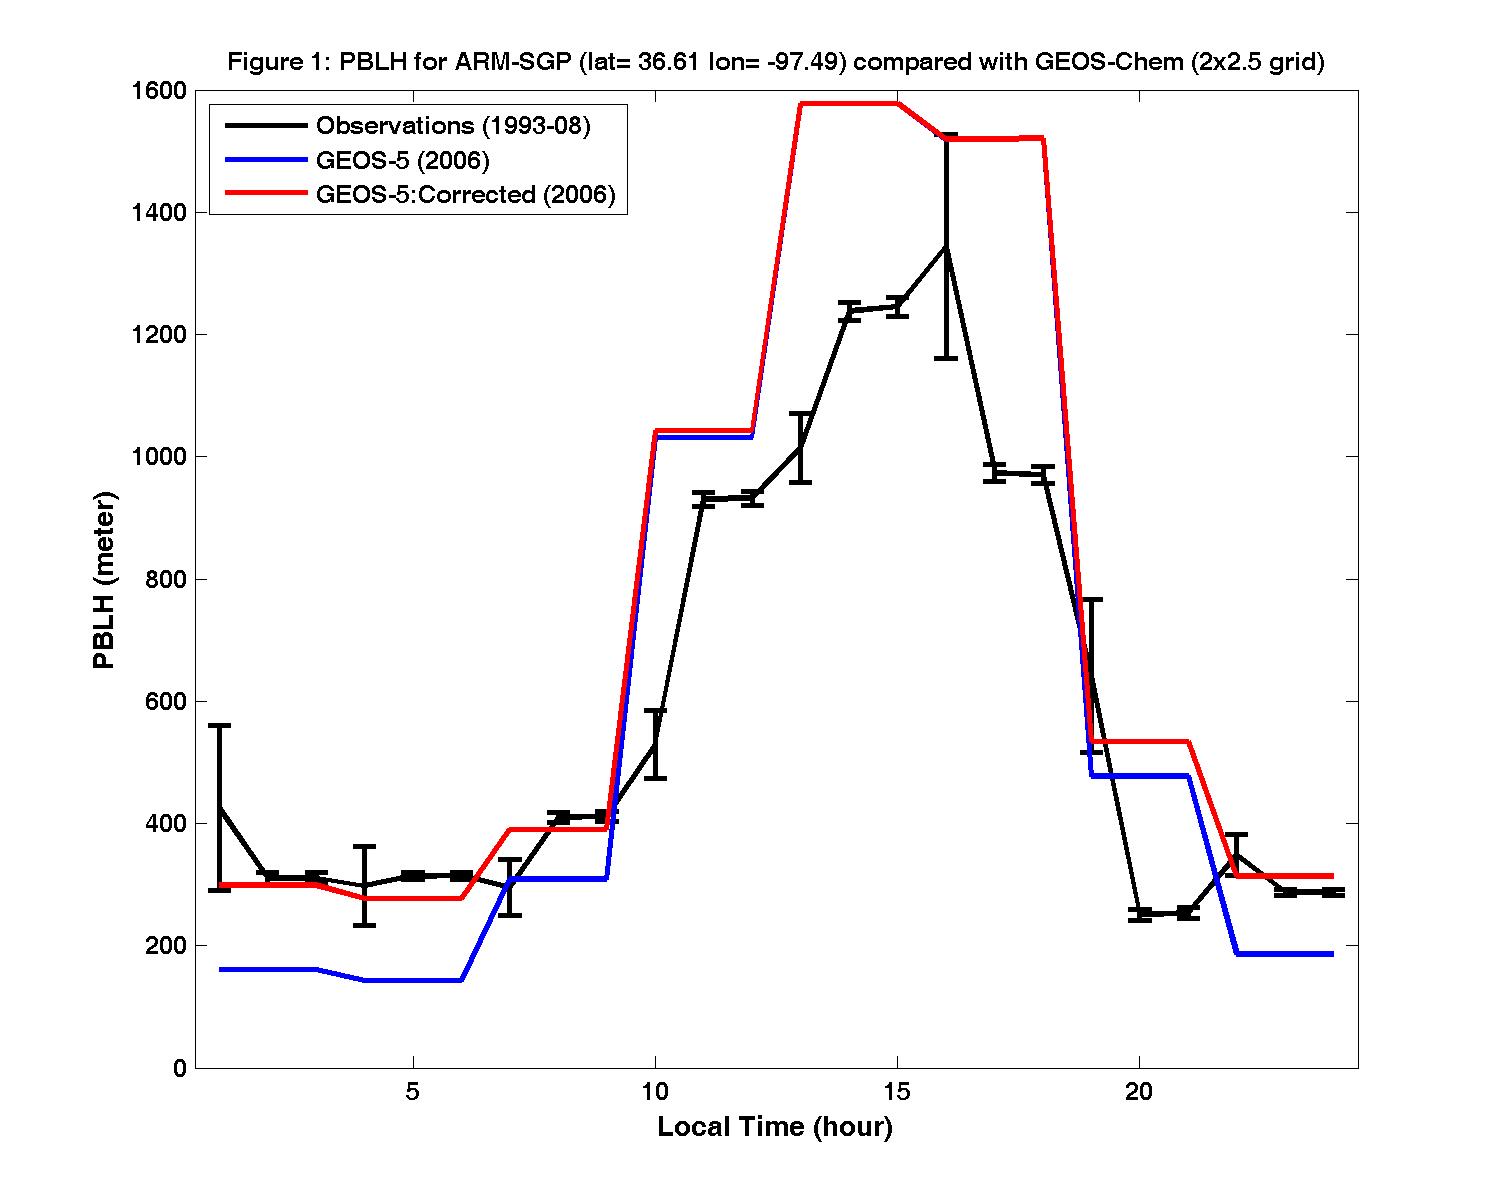
| 23:49, 19 June 2012 | Figure 1.jpg (file) |  |
113 KB | Sajeev Philip | 1 | |
| 23:35, 19 June 2012 | Figure-1.jpg (file) |  |
113 KB | Sajeev Philip | 7 | |
| 19:58, 14 June 2012 | Figure-2.jpg (file) |  |
98 KB | Sajeev Philip | 1 | |
| 14:02, 13 June 2012 | CAC Readme.pdf (file) | 250 KB | Wai-Ho Lo | 1 | ||
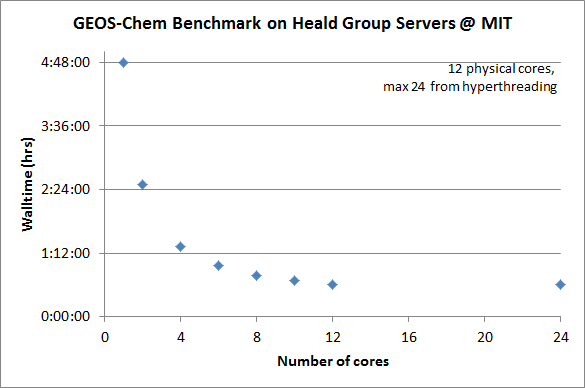
| 15:52, 17 April 2012 | Mit gc benchmark.png (file) |  |
11 KB | Bmy | Shows benchmarking results done by Colette Heald @ MIT using 1-24 CPUs. | 1 |
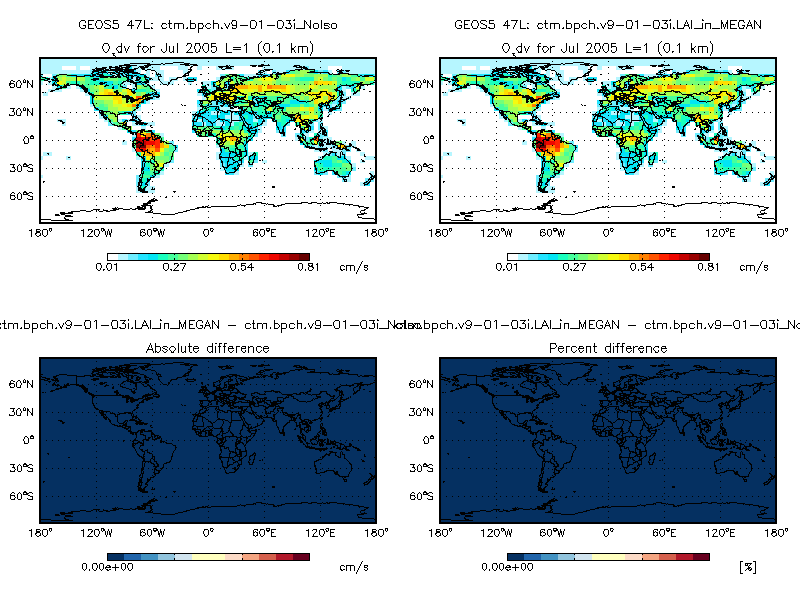
| 18:55, 13 April 2012 | Ox vd diff.png (file) |  |
29 KB | Bmy | Plot of O3 dry deposition velocities, comparing GEOS-Chem v9-01-03i (using the old LAI scheme) vs. the new LAI scheme. Plots were taken from 1-month simulations. Both used the Olson 1992 land map and MODIS LAI at 0.5 x 0.5 native resolution. | 1 |
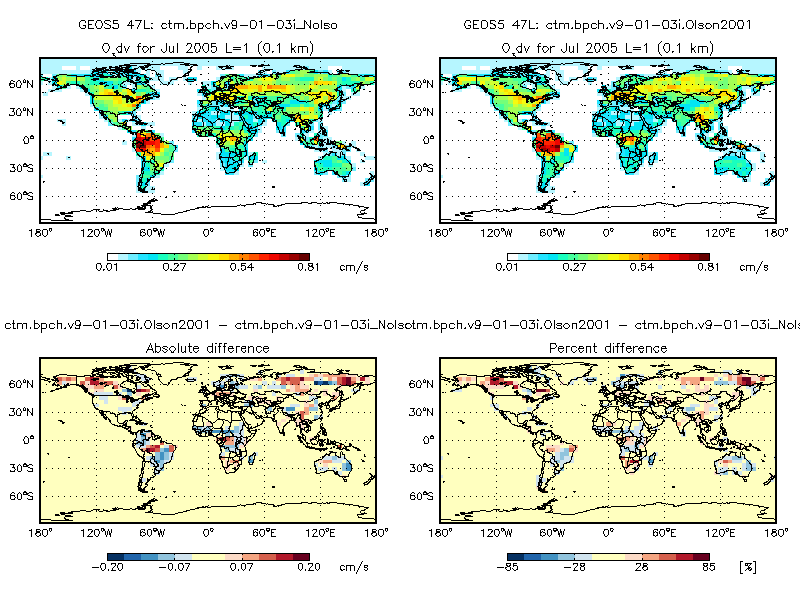
| 18:54, 13 April 2012 | Ox vd Olson2001 diff.png (file) |  |
40 KB | Bmy | Difference of O3 drydep velocities generated by GEOS-Chem v9-01-03i (using Olson 1992 land map) and with the Olson 20001 land map. Note that there are signfiicant differences. | 1 |
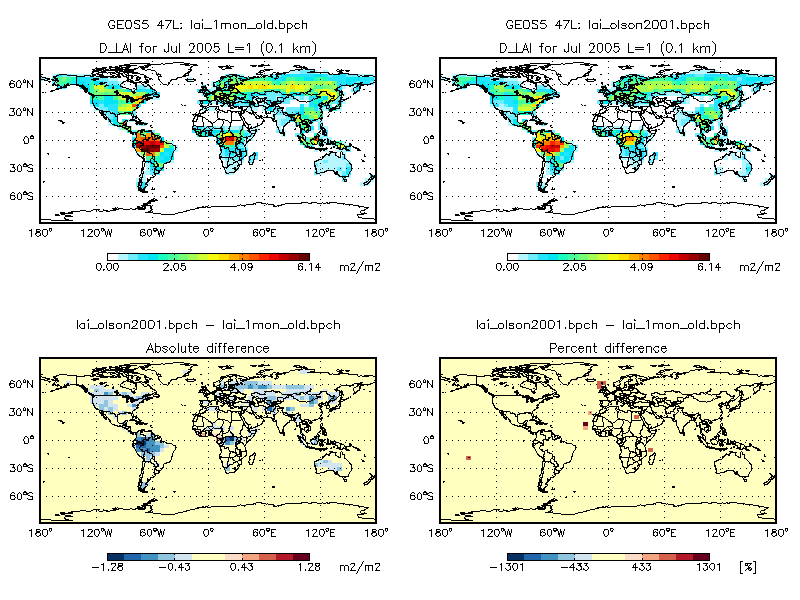
| 18:13, 13 April 2012 | Lai olson2001 diff.png (file) |  |
35 KB | Bmy | Plot showing the difference of MODIS LAI (regridded from 0.25 x 0.25) to MODIS LAI regridded from 1 x 1 resolution. | 1 |
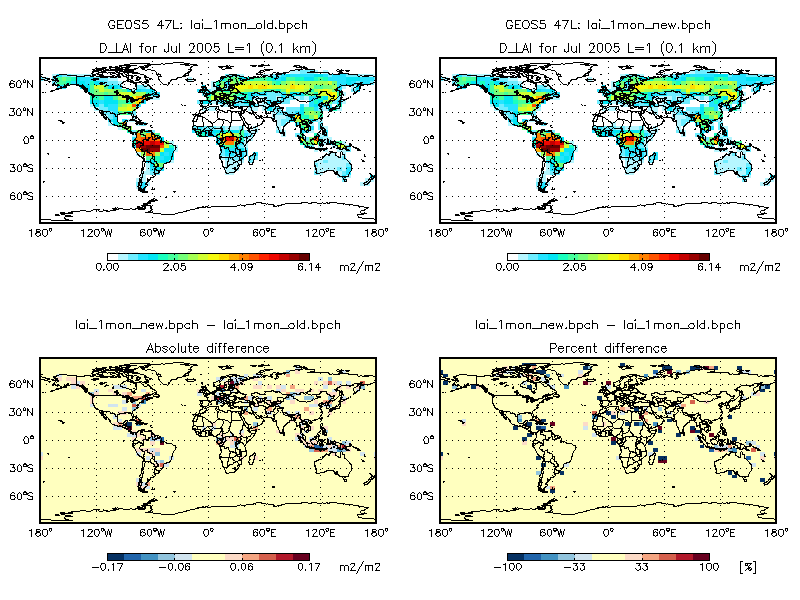
| 18:20, 12 April 2012 | Lai diff.png (file) |  |
34 KB | Bmy | Shows the difference in LAI between GEOS-Chem v9-01-03i and the new LAI scheme implemented with modis_lai_mod.F90. | 1 |
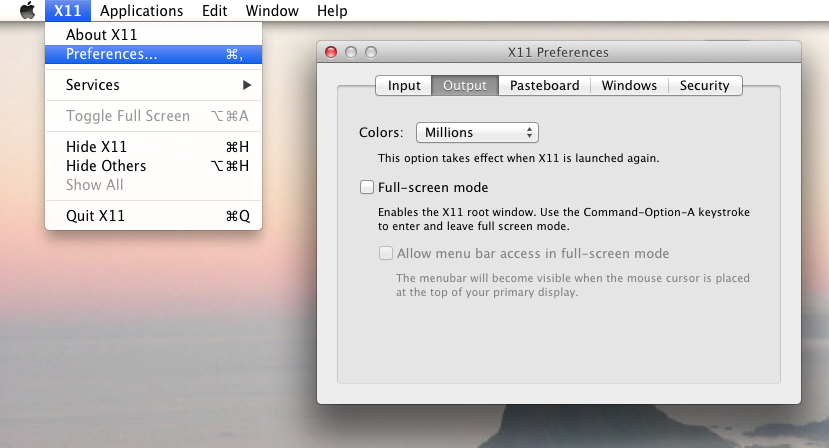
| 18:19, 12 April 2012 | Gamap xterm problem on Mac.png (file) |  |
140 KB | Bmy | Screenshot of proper setting for the # of colors in an Xterm on Mac | 1 |
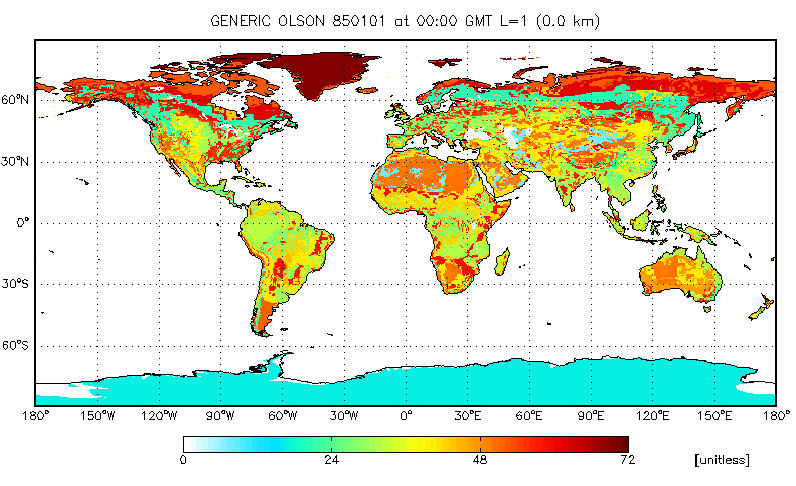
| 14:52, 23 March 2012 | Olson2001.png (file) |  |
72 KB | Bmy | Olson map, 2001 | 1 |
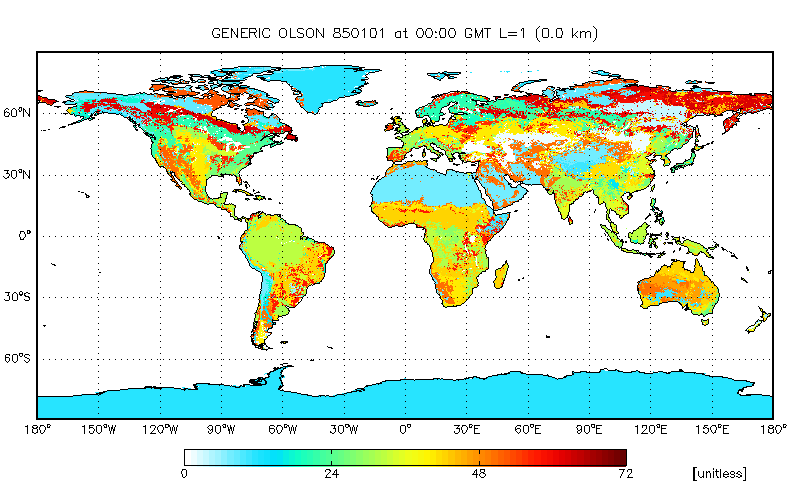
| 14:52, 23 March 2012 | Olson1992.png (file) |  |
68 KB | Bmy | Olson map, 1992 (now w/ 72 colors) | 2 |
| 18:36, 20 March 2012 | Vinken Appendix D.pdf (file) | 267 KB | Melissa Payer | 1 | ||
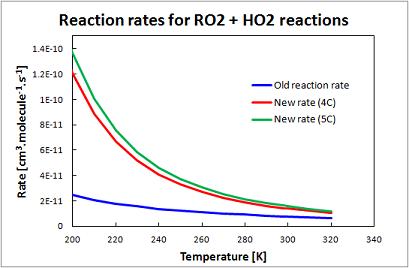
| 17:08, 5 December 2011 | Ro2 ho2 rate.jpg (file) |  |
19 KB | Emarais | Comparison of old and new RO2+HO2 reaction rates | 2 |
| 17:18, 29 November 2011 | F1 f4 jul small.png (file) |  |
298 KB | Bmy | From Helen Amos | 1 |
| 17:18, 29 November 2011 | F1 f4 jan small.png (file) |  |
304 KB | Bmy | 1 | |
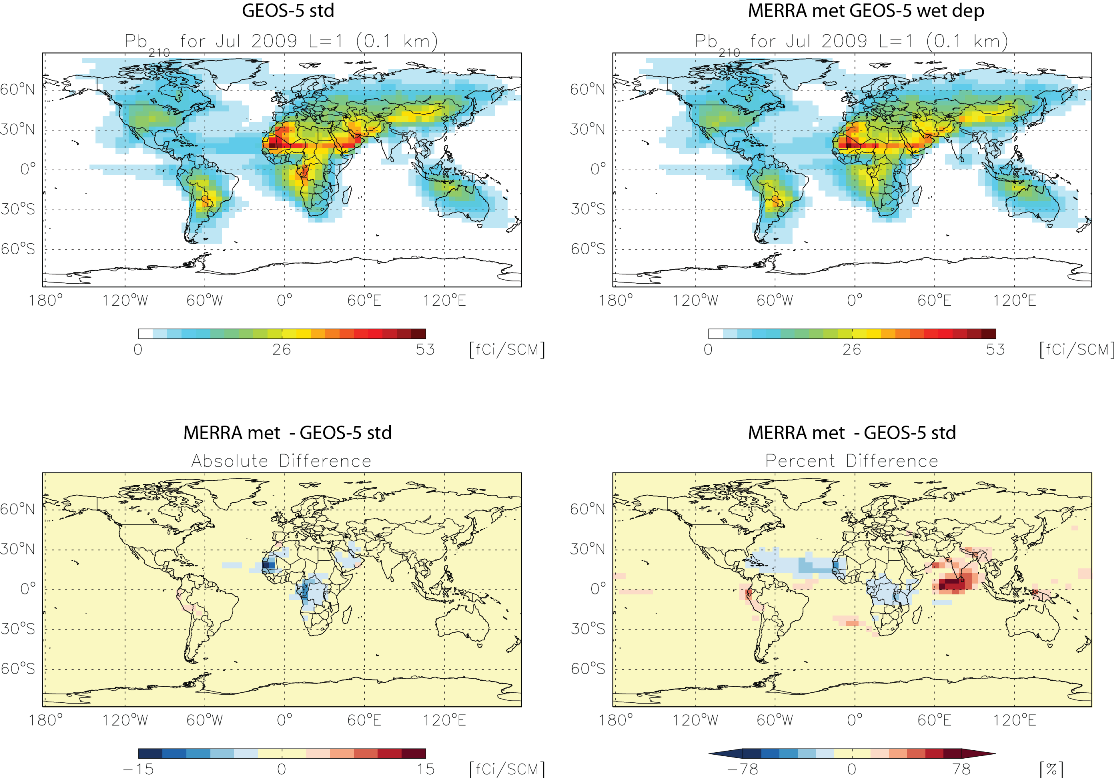
| 17:17, 29 November 2011 | F1 f3 jul small.png (file) |  |
287 KB | Bmy | From Helen Amos | 1 |
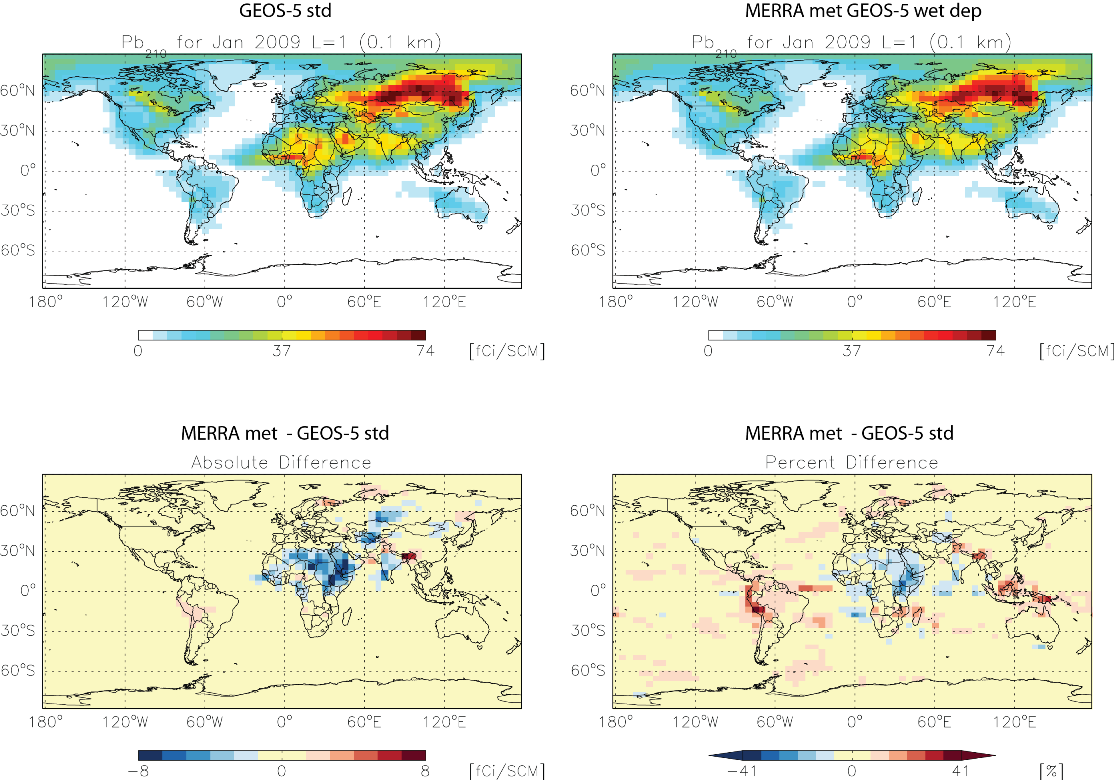
| 17:17, 29 November 2011 | F1 f3 jan small.png (file) |  |
296 KB | Bmy | 1 | |
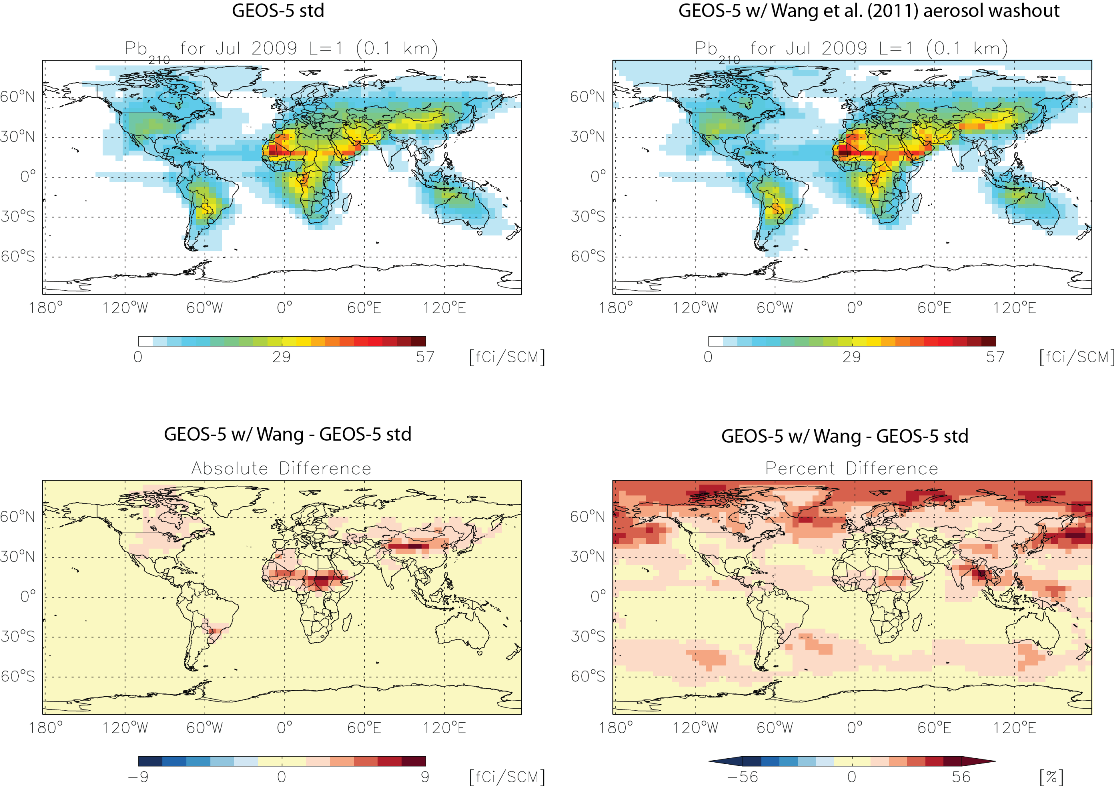
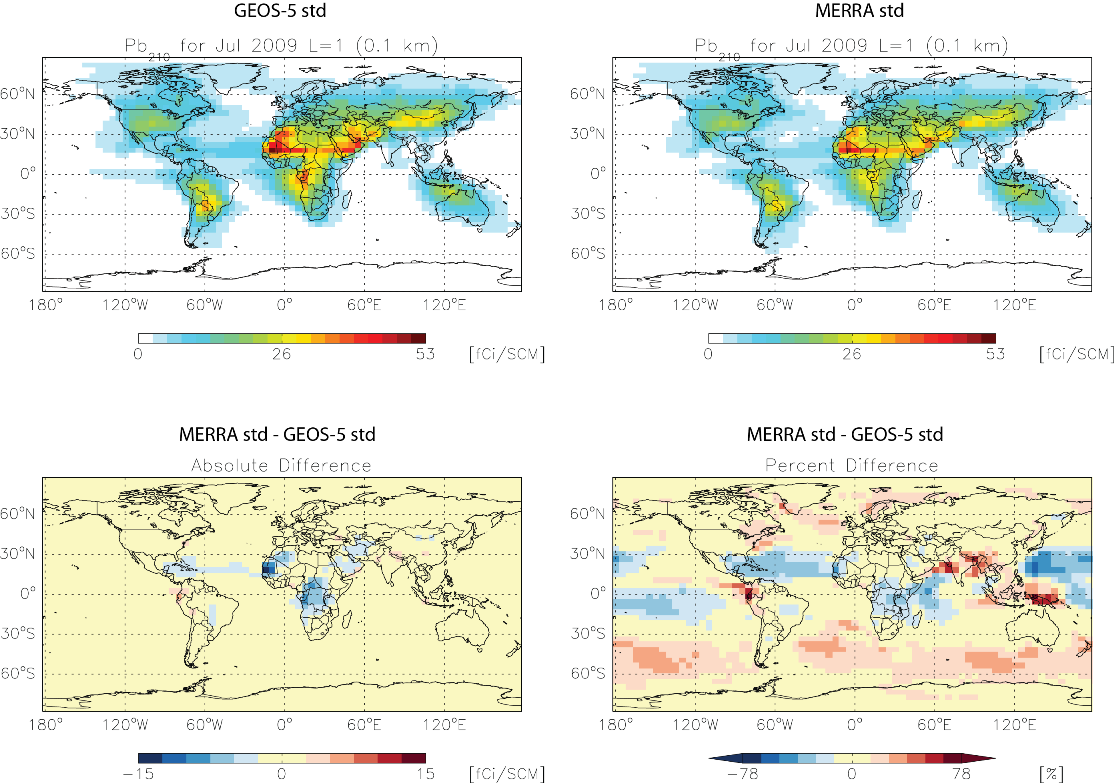
| 17:17, 29 November 2011 | F1 f2 jul small.png (file) |  |
294 KB | Bmy | From Helen Amos | 1 |
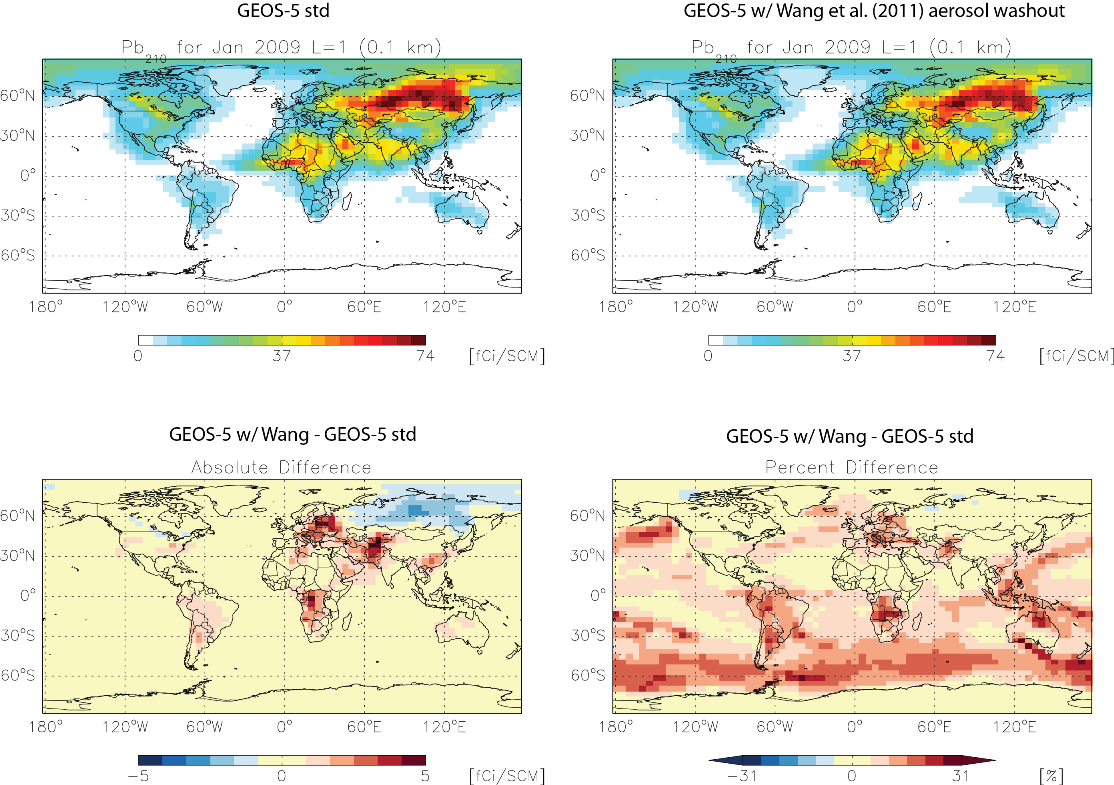
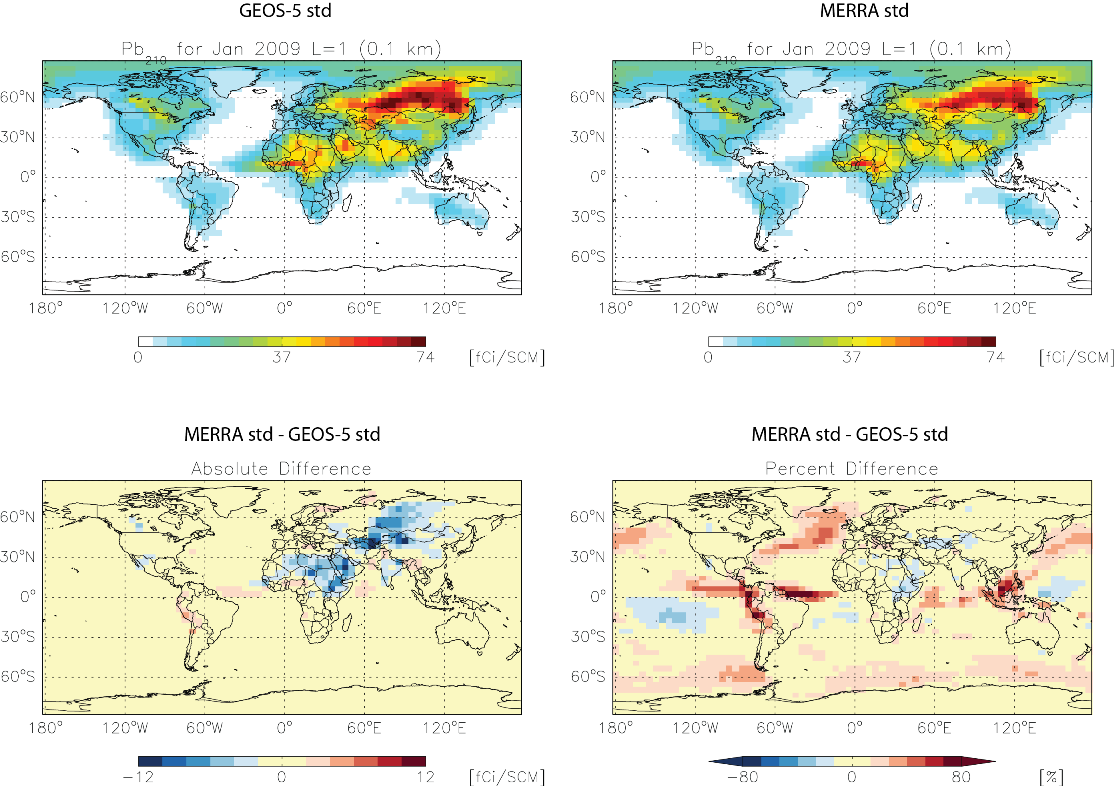
| 17:17, 29 November 2011 | F1 f2 jan small.png (file) |  |
296 KB | Bmy | From Helen Amos | 1 |
First page |
Previous page |
Next page |
Last page |