GEOS-Chem 1-month benchmark timing results
Previous | Next | Guide to GEOS-Chem performance
- Parallelizing GEOS-Chem
- GEOS-Chem 7-day timing tests
- GEOS-Chem scalability
- GEOS-Chem 1-month benchmark timing results
- Profiling GEOS-Chem with the TAU performance system
- Speeding up GEOS-Chem
Overview
On this page, we provide timing results obtained from 1-month benchmark GEOS-Chem simualtions.
Timing results from 1-month benchmarks
To access the entire history of GEOS-Chem benchmarks, please see our GEOS-Chem versions page.
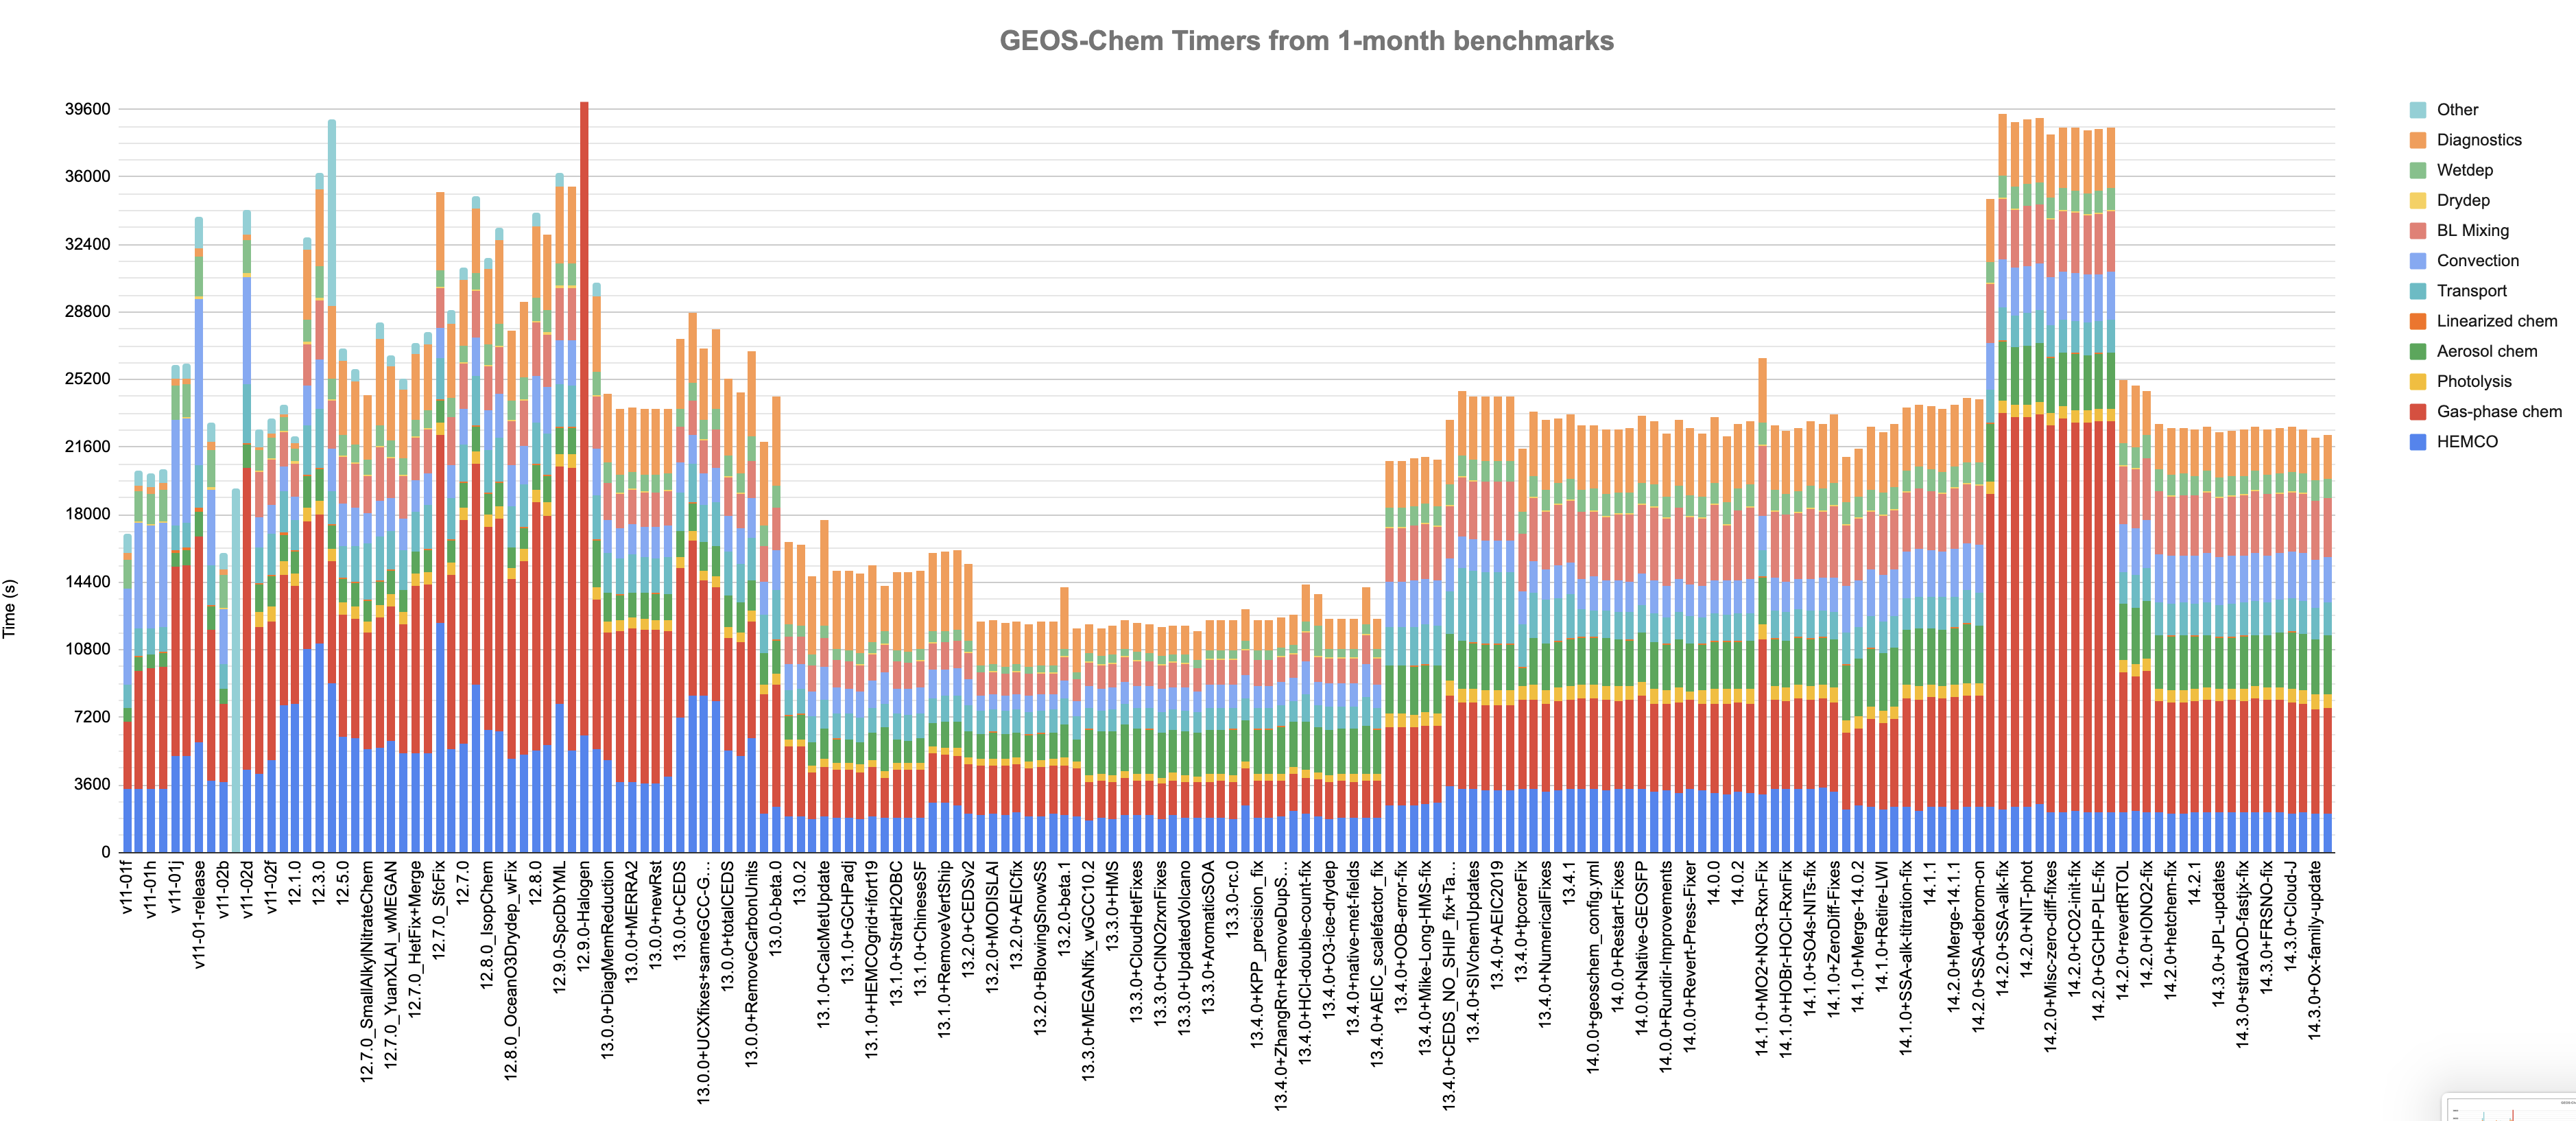
Wall time spent in model components
The above plot displays the "wall clock" time spent in each model component as observed in the GEOS-Chem timers output from recent public and internal 1-month benchmark simulations (Credit: Melissa Sulprizio). This type of plot can be very helpful in determining if updates made to GEOS-Chem cause significant computational bottlenecks.
Timing information is obtained from the GEOS-Chem "Timers" output, which is printed to the log file. Timers output is activated when compiling GEOS-Chem with TIMERS=y (GNU Make) or -DTIMERS=y and turning on timers in input.geos.
--Bob Yantosca (talk) 20:58, 21 February 2020 (UTC)
Overall wall time
File:GC 1mon benchmark timing.png
The above plot displays the "wall clock" time from recent 1-month GEOS-Chem benchmarks. All results displayed are from simulations that ran on all 24 CPUs of the holyjacob*.rc.fas.harvard.edu nodes (Intel(R) Xeon(R) CPU E5-2680 v3 @ 2.50 GHz) on Harvard's Odyssey cluster.
--Melissa Sulprizio (talk) 13:14, 20 September 2018 (UTC)
For more information
