Profiling GEOS-Chem
On this page, we provide information on how you can use software profiling tools with GEOS-Chem.
Overview
Profiling is a debugging technique that allows you to examine how much time is spent in a given GEOS-Chem routine. This is helpful in identifying potential bottlenecks caused by sub-optimally written code. GEOS-Chem v11-01 and higher versions contains support for two software profiling packages:
- gprof, the GNU profiler
- TAU Performance System, the Tuning and Analysis Utilities supported by ParaTools, Inc.
The following sections describe how you can use GEOS-Chem with these utilities.
--Bob Yantosca (talk) 18:25, 14 December 2016 (UTC)
Profiling GEOS-Chem with gprof
The GNU profiler (gprof) is a free, open source software package that you can use to determine which GEOS-Chem routines take the most time to execute. If your computer system has the GNU Compiler Collection (GCC) already installed (as do most modern Unix/Linux clusters), then gprof should also be available for you to use. GEOS-Chem v11-01 and higher versions contain support for gprof.
Compiling and running GEOS-Chem with gprof
To profile GEOS-Chem, you must first compile with the GPROF=y Makefile option, e.g.:
make -j4 GPROF=y ...etc. other makefile options ...
This will add the following compiler switches to the compilation sequence:
| Compiler | Switch to invoke gprof |
|---|---|
| Intel Fortran compiler (ifort) | -p |
| GNU Fortran compiler (gfortran) | -pg |
| PGI Fortran compiler (pgfortran) | -pg |
Once you have compiled GEOS-Chem with GPROF=y, you can run GEOS-Chem as you normally would. GEOS-Chem will create a binary file called gmon.out containing the profiling information. To generate readable output from gmon.out, you need to call the gprof program as described in the next section.
--Bob Yantosca (talk) 18:09, 14 December 2016 (UTC)
Generating profiling output
The general syntax for calling gprof is:
gprof [optional commands] [name of GEOS-Chem executable file] gmon.out > [name of text file to contain profiling results]
Please see this list of optional commands for gprof from the web-based documentation.
--Bob Yantosca (talk) 18:09, 14 December 2016 (UTC)
Creating a table of time spent in each GEOS-Chem routine
To create a simple text table of time spent in each GEOS-Chem subroutine (also called a flat profile), you can call gprof as follows:
gprof geos.mp gmon.out > GEOS-Chem_Profile_Results.txt
where geos.mp is the GEOS-Chem executable file. (It may have a different name than geos.mp depending on how, and in which run directory, you compiled GEOS-Chem.) You can also refine the output by specifying optional commands to gprof.
The GEOS-Chem_Profile_Results.txt file will contain output similar to this:
Flat profile:

Each sample counts as 0.01 seconds.
  %   cumulative   self              self     total
 time   seconds   seconds    calls  Ks/call  Ks/call  name
 16.50    801.03   801.03 11317370     0.00     0.00  gckpp_linearalgebra_mp_kppdecomp_
  9.63   1268.29   467.26 43751785     0.00     0.00  gckpp_linearalgebra_mp_kppsolve_
  6.29   1573.53   305.24 26835672     0.00     0.00  gckpp_function_mp_fun_
  4.09   1772.06   198.53    17402     0.00     0.00  tpcore_fvdas_mod_mp_fzppm_
  4.04   1967.96   195.90  6834149     0.00     0.00  gckpp_jacobian_mp_jac_sp_
  2.86   2106.99   139.03       72     0.00     0.04  flexchem_mod_mp_do_flexchem_
  2.23   2215.23   108.25 182368327     0.00     0.00  gckpp_linearalgebra_mp_waxpy_
  2.20   2322.10   106.87    45915     0.00     0.00  convection_mod_mp_do_merra_convection_
  2.05   2421.82    99.72      648     0.00     0.00  dao_mod_mp_airqnt_
  2.05   2521.43    99.61     3051     0.00     0.00  fast_jx_mod_mp_blkslv_
  2.05   2620.81    99.38     3487     0.00     0.00  fast_jx_mod_mp_opmie_
  1.80   2708.34    87.53      144     0.00     0.00  convection_mod_mp_do_convection_
  1.78   2794.64    86.30     6533     0.00     0.00  vdiff_mod_mp_vdiff_
  ... etc ...
The information is arranged into several columns:
| Column | Description |
|---|---|
| % time | This is the percentage of the total execution time your program spent in this function. These should all add up to 100%. |
| cumulative seconds | This is the cumulative total number of seconds the computer spent executing this functions, plus the time spent in all the functions above this one in this table. |
| self seconds | This is the number of seconds accounted for by this function alone. The flat profile listing is sorted first by this number. |
| calls | This is the total number of times the function was called. If the function was never called, or the number of times it was called cannot be determined (probably because the function was not compiled with profiling enabled), the calls field is blank. |
| self ms/call | This represents the average number of milliseconds spent in this function per call, if this function is profiled. Otherwise, this field is blank for this function. |
| total ms/call | This represents the average number of milliseconds spent in this function and its descendants per call, if this function is profiled. Otherwise, this field is blank for this function. This is the only field in the flat profile that uses call graph analysis. |
| name | This is the name of the function. The flat profile is sorted by this field alphabetically after the self seconds and calls fields are sorted. |
Looking down the self seconds column will show you the amount of time spent in each routine. From the example above, we see that the first 3 routines (which are part of the KPP chemical solver) account for approximately one-third of the total run time.
--Bob Yantosca (talk) 18:19, 14 December 2016 (UTC)
Using PLOT_GPROF to create plots from the profiling data
NOTE: The PLOT_GPROF routine is available in GAMAP v2-19 (release date 15 Dec 2016) and higher versions.
You can use GAMAP routine PLOT_GPROF to create a bar chart of the profiling results obtained from the gprof profiler. PLOT_GPROF takes the following inputs:
; CALLING SEQUENCE:
;        PLOT_GPROF, FILENAME [,keywords]
;
; INPUTS
;        FILENAME -> Text file containing profiling output from gprof.
;
; KEYWORD PARAMETERS:
;        N_DISPLAY -> The number of routines to display, from slowest
;             to fastest.  The default is 30.
;
;        BARCOLOR -> The color table value that will be used to plot
;             the bars.  Default is !MYCT.RED.
;
;        /VERBOSE -> If set, will print a listing of the N_DISPLAY
;             slowest routines.  The routine name, execution time,
;             and percentage of total run time will be printed.
To make a plot from the the profiling output that we generated in the example above, type this command at the IDL prompt:
IDL> plot_gprof, 'GEOS-Chem_Profile_Results.txt'
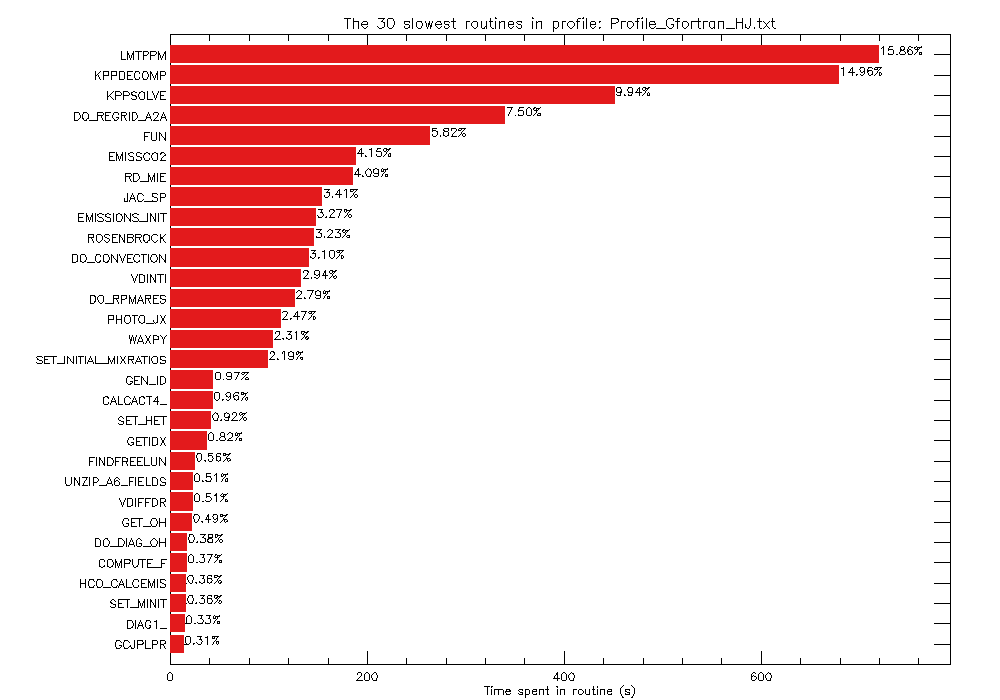
This will generate a plot that looks like this:
The length of the bar represents the time spent in each routine. The numbers printed to the right of each bar represent the percentage of the total execution time spent in that routine. If you would also like to get a printout of this information, use the /VERBOSE keyword. Typing:
IDL> plot_gprof, 'GEOS-Chem_Profile_Results.txt', /Verbose
will create the plot above but also will print to the screen the time spent in each routine in seconds, plus the percentage of the total run time spent in each routine.
The 30 slowest routines in profile: Profile_Gfortran_HJ.txt
   1  LMTPPM                            720.110 s    15.860 %
   2  KPPDECOMP                         679.390 s    14.960 %
   3  KPPSOLVE                          451.530 s     9.940 %
   4  DO_REGRID_A2A                     340.670 s     7.500 %
   5  FUN                               264.420 s     5.820 %
   6  EMISSCO2                          188.590 s     4.150 %
   7  RD_MIE                            185.620 s     4.090 %
   8  JAC_SP                            154.700 s     3.410 %
   9  EMISSIONS_INIT                    148.260 s     3.270 %
  10  ROSENBROCK                        146.630 s     3.230 %
  11  DO_CONVECTION                     140.720 s     3.100 %
  12  VDINTI                            133.510 s     2.940 %
  13  DO_RPMARES                        126.700 s     2.790 %
  14  PHOTO_JX                          112.290 s     2.470 %
  15  WAXPY                             104.820 s     2.310 %
  16  SET_INITIAL_MIXRATIOS              99.390 s     2.190 %
  17  GEN_ID                             44.030 s     0.970 %
  18  CALCACT4_                          43.530 s     0.960 %
  19  SET_HET                            41.780 s     0.920 %
  20  GETIDX                             37.350 s     0.820 %
  21  FINDFREELUN                        25.320 s     0.560 %
  22  UNZIP_A6_FIELDS                    23.130 s     0.510 %
  23  VDIFFDR                            22.990 s     0.510 %
  24  GET_OH                             22.290 s     0.490 %
  25  DO_DIAG_OH                         17.220 s     0.380 %
  26  COMPUTE_F                          16.820 s     0.370 %
  27  HCO_CALCEMIS                       16.480 s     0.360 %
  28  SET_MINIT                          16.460 s     0.360 %
  29  DIAG1_                             15.050 s     0.330 %
  30  GCJPLPR                            14.080 s     0.310 %
By default, PLOT_GPROF will show the 30 slowest routines. You can change the number of routines displayed by specifying a value with the N_DISPLAY keyword, e.g.
IDL> plot_gprof, 'GEOS-Chem_Profile_Results.txt', N_DISPLAY=40
--Bob Yantosca (talk) 20:50, 15 December 2016 (UTC)
For more information
We invite you to read the gprof Manual to learn about other types of profiling output that you can generate with gprof.
CAVEAT! The gprof profiler might not include time spent in external library functions such as netCDF. See this post for more information.
--Bob Yantosca (talk) 18:30, 14 December 2016 (UTC)
Profiling GEOS-Chem with TAU
The TAU Performance System is a profiling tool for performance analysis of parallel programs in Fortran, C, C++, Java, and Python. TAU uses a visualization tool, ParaProf, to create graphical displays of the performance analysis results.
Setting up TAU compiler
To install TAU on your system, follow the instructions on the TAU Software Download page. On some systems, you can load pre-compiled software packages with the module command. check with your system administrator or IT staff to see if a TAU module is already installed on your system. If it is, we recommend that you module to load TAU into your computing environment. For example:
module load tau/2.24.1-fasrc01 # Load TAU
You can also create a TAU_OPTIONS environment variable for your system startup file:
 If you use bash, add this to your ~/.bashrc:

    # Options for TAU profiler
    export TAU_OPTIONS="-optRevert -optVerbose -optPreProcess -optContinueBeforeOMP"

 If you use csh or tcsh, add this to your ~/.cshrc:

    # Options for TAU profiler
    setenv TAU_OPTIONS "-optRevert -optVerbose -optPreProcess -optContinueBeforeOMP"
A list of options available to the TAU compiler scripts can be found by typing man tau_compiler.sh. For more detailed information on TAU, see the TAU User's Guide.
Compiling and running GEOS-Chem with TAU
To profile GEOS-Chem with TAU, you must first compile with the TAU_PROF=y Makefile option, e.g.:
 # Remove files from a previous compilation with TAU (if necessary)
 make tauclean

 # Compile with TAU profiling
 make TAU_PROF=y ...etc. other makefile options ...
It is important that you compile on a single processor (i.e. don't pass -j4 or -j8) to allow TAU to properly instrument the code.
The TAU_PROF=y option will set COMPILE_CMD :=tau_f90.sh instead of COMPILE_CMD :=$(FC) where FC is ifort, gfortran, or pgfortran.
Once you have compiled GEOS-Chem with TAU_PROF=y, you can run GEOS-Chem as you normally would. GEOS-Chem will create profile.* files containing the profiling information.
Using ParaProf to create plots from the profiling data
In your run directory, there should be one or more profile.* files. The number of profile.* files will depend on the number of CPUs that you use for your GEOS-Chem simulation. To pack all of the profiling data into a single file, type:
paraprof --pack GEOS-Chem_Profile_Results.ppk
Then run paraprof on the packed format (.ppk) file using:
paraprof GEOS-Chem_Profile_Results.ppk
This will open two windows, the ParaProf Manager window and the Main Data window. For more information on how to interpret the profiling data, see the ParaProf User's Manual.
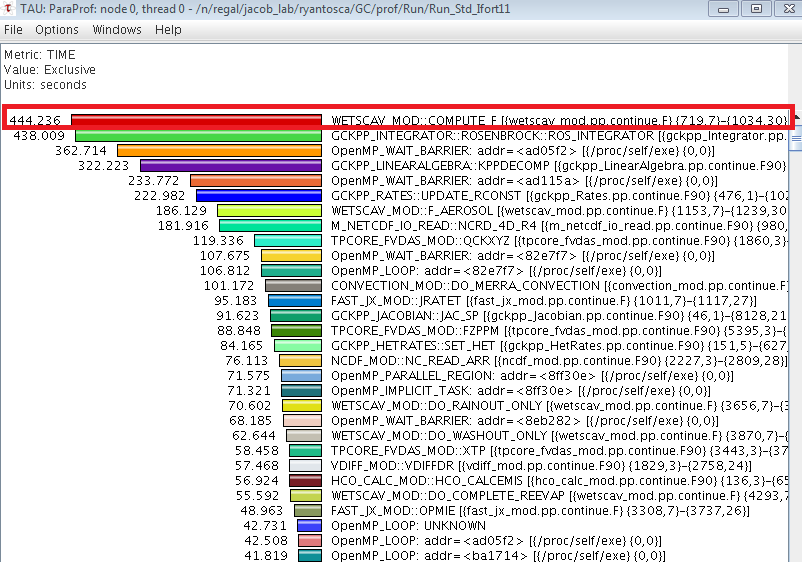
If you click on the the bar labeled "thread0" in the ParaProf manager window, you can generate a plot that looks like this:
The value displayed, the units, and the sort order can be changed from the Options menu. The time that each subroutine spent on the master thread is displayed as a histogram. By examining the histogram you can see which routines are taking the longest to execute. For example, the above plot shows that the COMPUTE_F routine (highlighted with the red box) is spending 444 seconds on the master thread, which is longer than the Rosenbrock solver takes to run. This is a computational bottleneck, which was ultimately caused by an unparallelized DO loop.
To save the plot, select "Save as Bitmap Image" from the File menu. In the Save Image File window, you may select the output type (JPEG File or PNG file) and specify the file name and location.
--Melissa Sulprizio (talk) 22:48, 8 February 2017 (UTC)
--Bob Yantosca (talk) 16:55, 10 February 2017 (UTC)

