GEOS-Chem 1-month benchmark timing results: Difference between revisions
Jump to navigation
Jump to search
No edit summary |
|||
| Line 11: | Line 11: | ||
[[Image:GEOS-Chem Timers from 1-month benchmarks.png|1200px]] | [[Image:GEOS-Chem Timers from 1-month benchmarks.png|1200px]] | ||
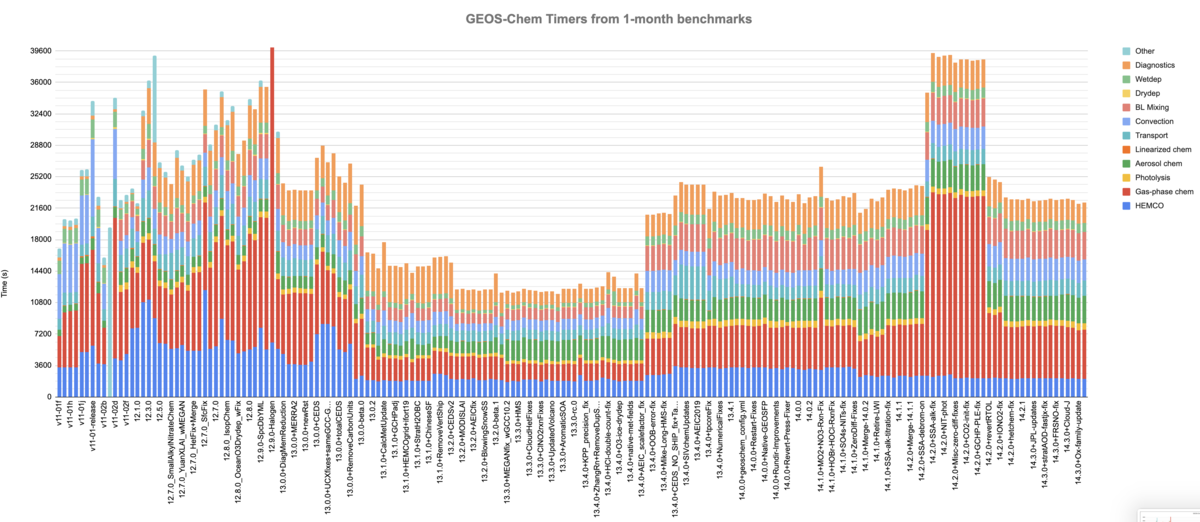
The above plot displays the "wall clock" time spent in each model component as observed in the | The above plot displays the "wall clock" time spent in each model component as observed in the GEOS-Chem timers output from 1-month benchmark simulations. This type of plot can be very helpful in determining if updates made to GEOS-Chem cause significant computational bottlenecks. Timers output is activated by setting <tt>use_gcclassic_timers: true</tt> in geoschem_config.yml and is printed to the log file. | ||
Latest revision as of 17:32, 25 March 2024
Overview
On this page, we provide timing results obtained from 1-month benchmark GEOS-Chem simualtions.
Timing results from 1-month benchmarks
To access the entire history of GEOS-Chem benchmarks, please see our GEOS-Chem versions page.
Wall time spent in model components
The above plot displays the "wall clock" time spent in each model component as observed in the GEOS-Chem timers output from 1-month benchmark simulations. This type of plot can be very helpful in determining if updates made to GEOS-Chem cause significant computational bottlenecks. Timers output is activated by setting use_gcclassic_timers: true in geoschem_config.yml and is printed to the log file.
