Mean OH concentration: Difference between revisions
Jump to navigation
Jump to search
| (3 intermediate revisions by the same user not shown) | |||
| Line 1: | Line 1: | ||
On this page we track the evolution of the mean OH concentration in GEOS-Chem. This value is an indicator of how "hot" the chemistry is. Please also see the related topic about the [[Methyl chloroform lifetime|methyl chloroform lifetime in GEOS-Chem]]. | On this page we track the evolution of the mean OH concentration in GEOS-Chem. This value is an indicator of how "hot" the chemistry is. Please also see the related topic about the [[Methyl chloroform lifetime|methyl chloroform lifetime in GEOS-Chem]]. | ||
== Evolution of mean OH in GEOS-Chem == | == Evolution of mean OH in GEOS-Chem == | ||
| Line 58: | Line 5: | ||
=== Plot of mean OH evolution === | === Plot of mean OH evolution === | ||
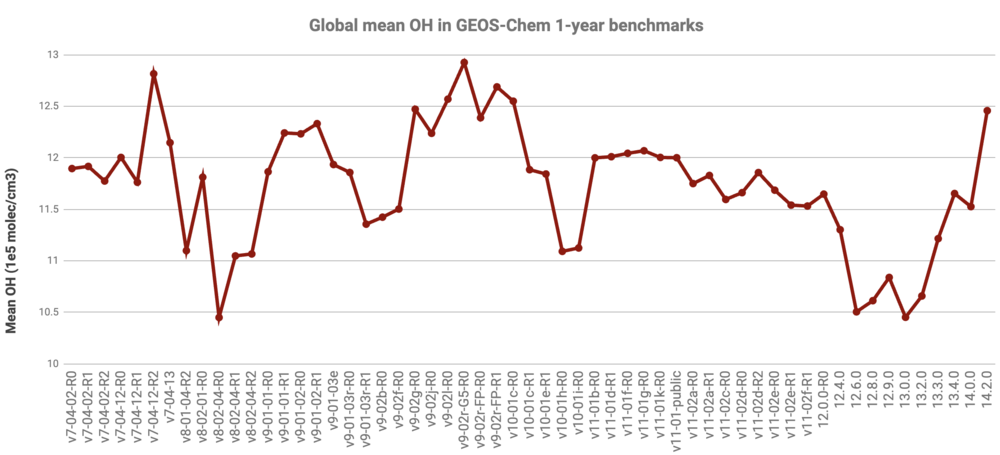
Here is a plot of the mean OH concentration from GEOS-Chem 1-year benchmark simulations | Here is a plot of the mean OH concentration from GEOS-Chem 1-year benchmark simulations. The mean OH is an indicator how the chemistry mechanism is performing. Typical values are 10–12 x 10<sup>5</sup> molecules cm<sup>-1</sup>. | ||
[[Image:GC_Mean_OH_12.8.0.png|1000px]] | |||
--[[User: | --[[User:Melissa Payer|Melissa Sulprizio]] ([[User talk:Melissa Payer|talk]]) 02:17, 13 August 2023 (UTC) | ||
Latest revision as of 14:54, 18 October 2023
On this page we track the evolution of the mean OH concentration in GEOS-Chem. This value is an indicator of how "hot" the chemistry is. Please also see the related topic about the methyl chloroform lifetime in GEOS-Chem.
Evolution of mean OH in GEOS-Chem
Plot of mean OH evolution
Here is a plot of the mean OH concentration from GEOS-Chem 1-year benchmark simulations. The mean OH is an indicator how the chemistry mechanism is performing. Typical values are 10–12 x 105 molecules cm-1.
--Melissa Sulprizio (talk) 02:17, 13 August 2023 (UTC)
