GEOS-Chem 1-month benchmark timing results: Difference between revisions
| Line 27: | Line 27: | ||
== For more information == | == For more information == | ||
#[[GEOS-Chem versions]] | #[[GEOS-Chem versions]] | ||
---- | ---- | ||
'''''[[GEOS-Chem 7-day timing tests|Previous]] | [[Profiling GEOS-Chem with the TAU performance system|Next]] | [[Guide to GEOS-Chem performance]]''''' | '''''[[GEOS-Chem 7-day timing tests|Previous]] | [[Profiling GEOS-Chem with the TAU performance system|Next]] | [[Guide to GEOS-Chem performance]]''''' | ||
Revision as of 18:02, 24 October 2023
Previous | Next | Guide to GEOS-Chem performance
- Parallelizing GEOS-Chem
- GEOS-Chem 7-day timing tests
- GEOS-Chem scalability
- GEOS-Chem 1-month benchmark timing results
- Profiling GEOS-Chem with the TAU performance system
- Speeding up GEOS-Chem
Overview
On this page, we provide timing results obtained from 1-month benchmark GEOS-Chem simualtions.
Timing results from 1-month benchmarks
To access the entire history of GEOS-Chem benchmarks, please see our GEOS-Chem versions page.
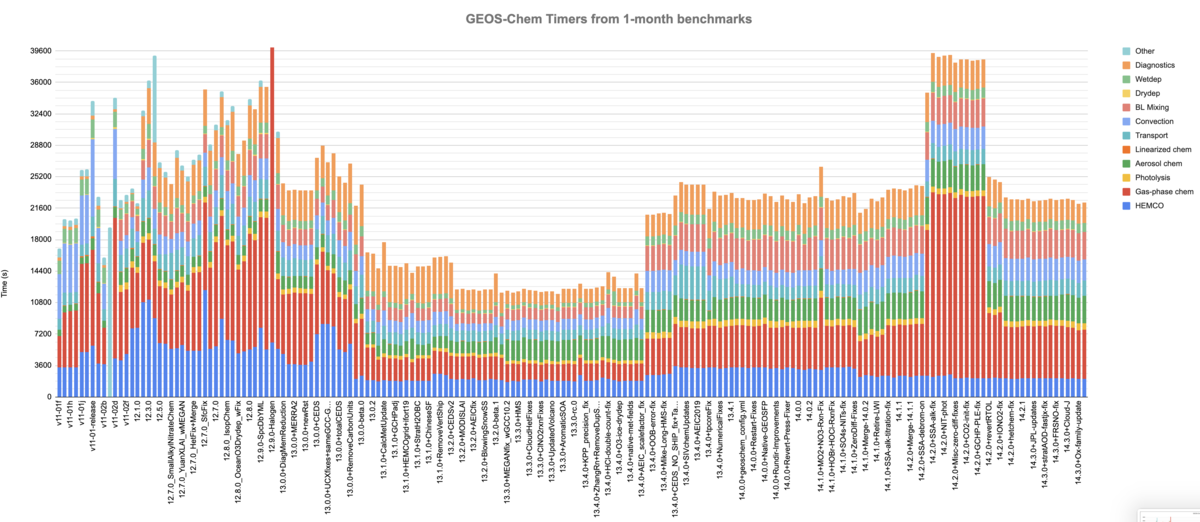
Wall time spent in model components
The above plot displays the "wall clock" time spent in each model component as observed in the GEOS-Chem timers output from recent public and internal 1-month benchmark simulations (Credit: Melissa Sulprizio). This type of plot can be very helpful in determining if updates made to GEOS-Chem cause significant computational bottlenecks.
Timing information is obtained from the GEOS-Chem "Timers" output, which is printed to the log file. Timers output is activated by setting use_gcclassic_timers: true in geoschem_config.yml.
