File list
This special page shows all uploaded files.
First page |
Previous page |
Next page |
Last page |
| Date | Name | Thumbnail | Size | Description | Versions |
|---|---|---|---|---|---|
| 20:15, 14 August 2015 | Google groups 4.png (file) | 3 KB | Tutorial slide #4 for Google groups interface | 1 | |
| 17:43, 21 September 2017 | LICENSE.txt (file) | 4 KB | GEOS-Chem License Agreement | 1 | |
| 17:13, 10 August 2018 | AUTHORS.txt (file) | 4 KB | Updated list of GC developers for 12.0.0 | 2 | |
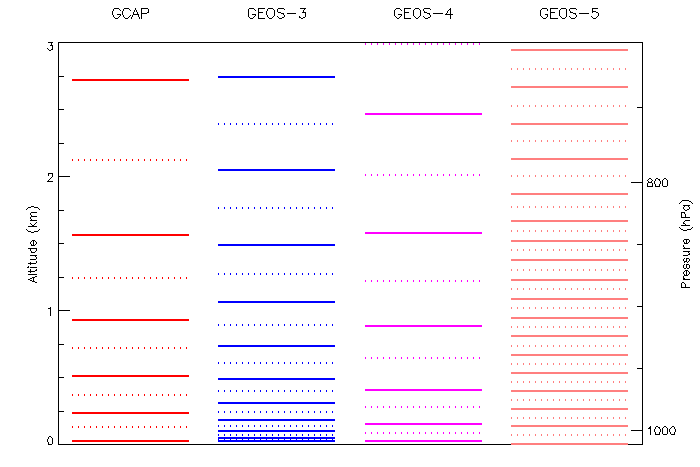
| 20:31, 14 November 2016 | Levels3km.png (file) |  |
5 KB | Comparison of vertical levels up to 3km | 1 |
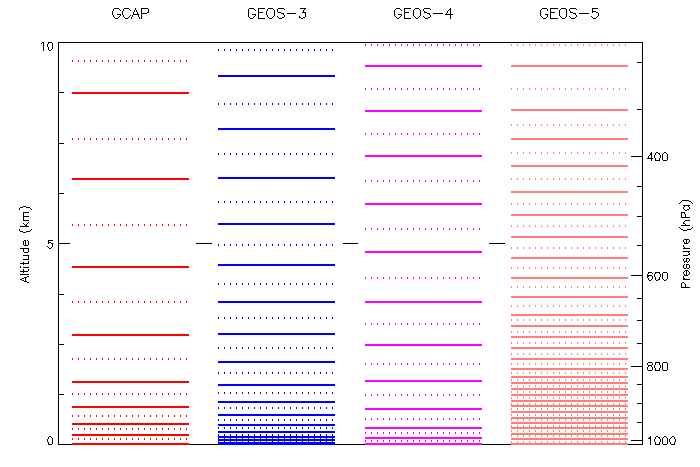
| 20:31, 14 November 2016 | Levels10km.png (file) |  |
6 KB | Comparison of vertical levels up to 10km | 1 |
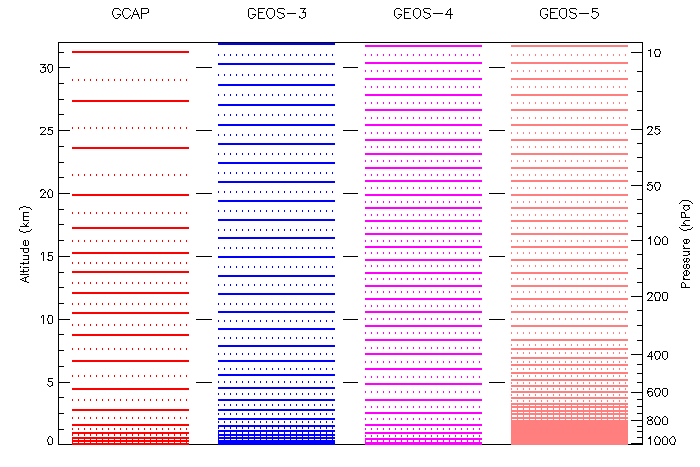
| 20:32, 14 November 2016 | Levels32km.png (file) |  |
7 KB | Comparison of vertical levels up to 32 km | 1 |
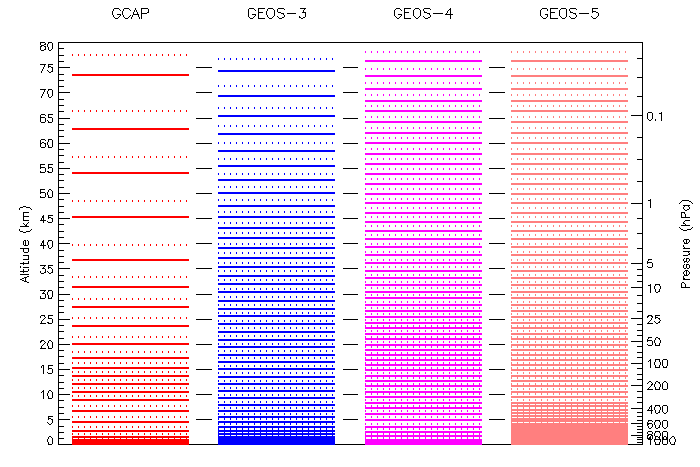
| 20:32, 14 November 2016 | Levels80km.png (file) |  |
9 KB | Comparison of vertical levels up to 80km | 1 |
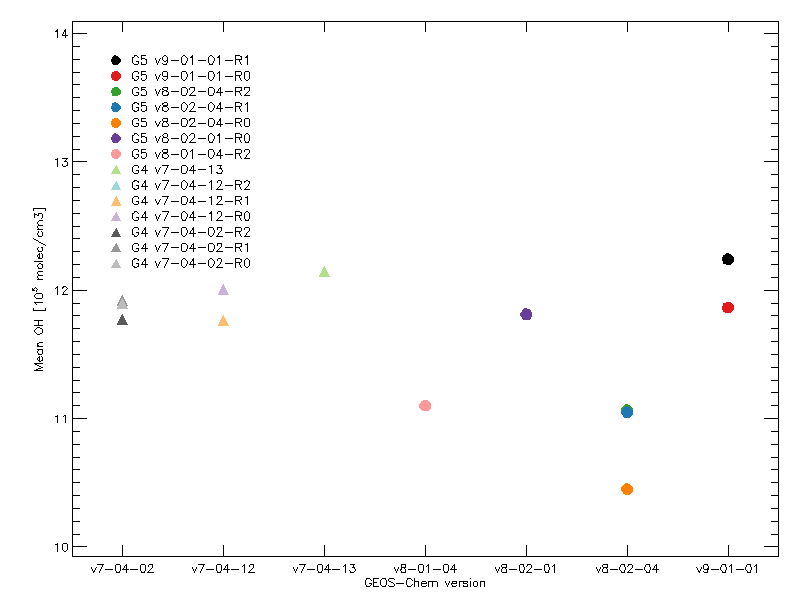
| 20:52, 8 June 2011 | Mean oh 1yr v9.png (file) |  |
10 KB | Upload file with version 9 OH on the plot | 1 |
| 18:51, 20 May 2014 | JAcetBlitz.pdf (file) | 11 KB | Test by Seb Eastham to see if the new acetone pressure dependency follows Blitz et al. | 1 | |
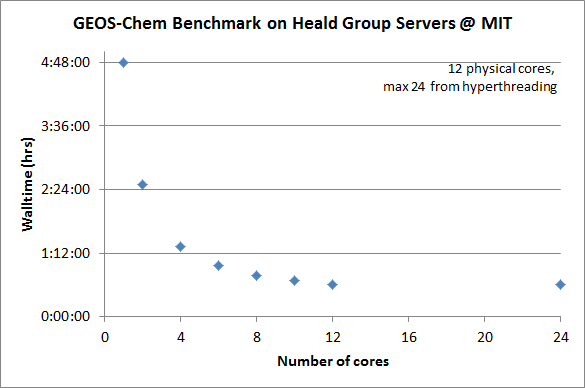
| 15:52, 17 April 2012 | Mit gc benchmark.png (file) |  |
11 KB | Shows benchmarking results done by Colette Heald @ MIT using 1-24 CPUs. | 1 |
| 15:34, 13 January 2020 | Getting Started with GC Thumbnail.png (file) |  |
11 KB | Thumbnail for "Getting Started with GEOS-Chem" tutorial | 1 |
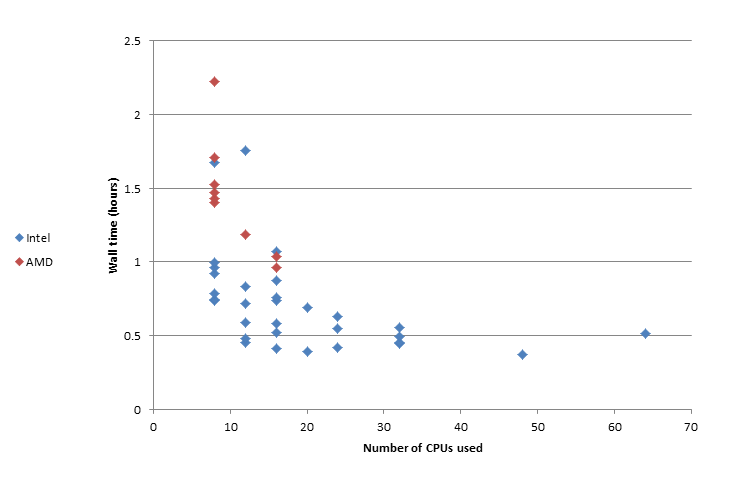
| 19:29, 17 December 2015 | 7 day time tests.png (file) |  |
12 KB | 7-day time test plot results, using red diamonds for AMD runs. Now also cropped. | 1 |
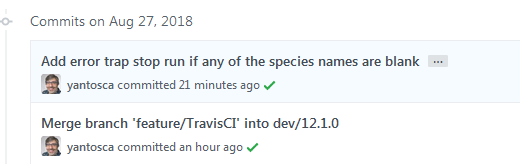
| 16:29, 27 August 2018 | Travis ci.png (file) |  |
12 KB | Sample of Github commit with green checkmark | 1 |
| 16:25, 13 January 2020 | Github Notifications Thumbnail.png (file) |  |
12 KB | Thumbnail for Github notifications video | 1 |
| 16:24, 13 January 2020 | Github issues thumbnail.png (file) |  |
13 KB | Thumbnail for Github issues video | 1 |
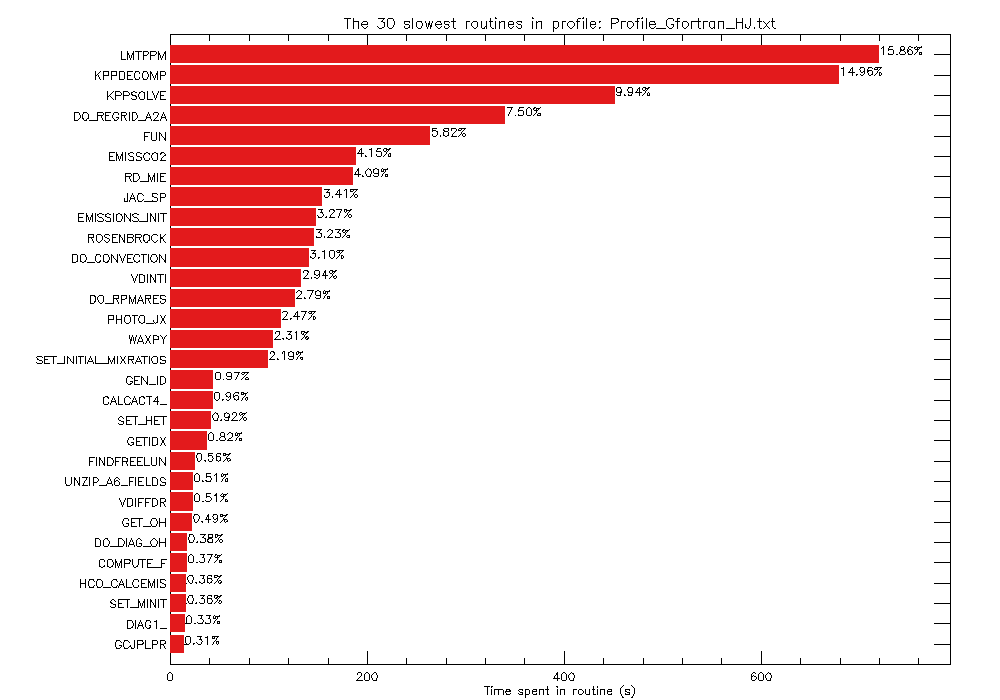
| 20:18, 15 December 2016 | Plot gprof output.png (file) |  |
14 KB | Example plot from the GAMAP "plot_gprof.pro" routine. | 1 |
| 15:10, 14 January 2020 | Dryrun thumbnail.png (file) |  |
15 KB | Updated dry-run thumbnail (smaller) | 2 |
| 16:26, 13 January 2020 | Github Searching thumbnail.png (file) |  |
15 KB | Thumbnail for "Searching for Github issues" video | 1 |
| 14:53, 16 January 2020 | Spack 1 thumbnail.png (file) |  |
15 KB | Thumbnail for Spack tutorial #1 video | 1 |
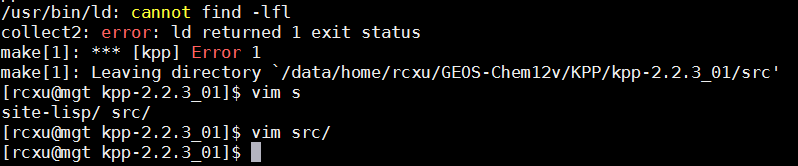
| 20:45, 15 July 2019 | Flexerror.png (file) | 16 KB | Screen shot of flex library not found error | 1 | |
| 14:53, 16 January 2020 | Spack 2 thumbnail.png (file) |  |
16 KB | Thumbnail for Spack tutorial #2 video | 1 |
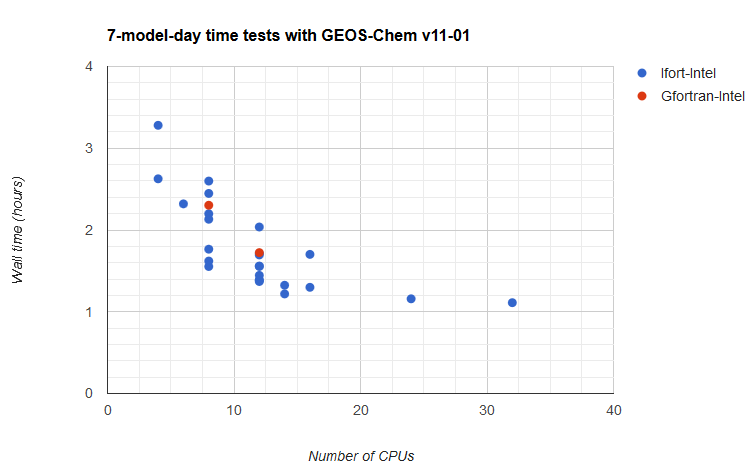
| 15:42, 10 March 2017 | V11-01-time-test-results.png (file) |  |
17 KB | Timing test results updated 10 Mar 2017 | 1 |
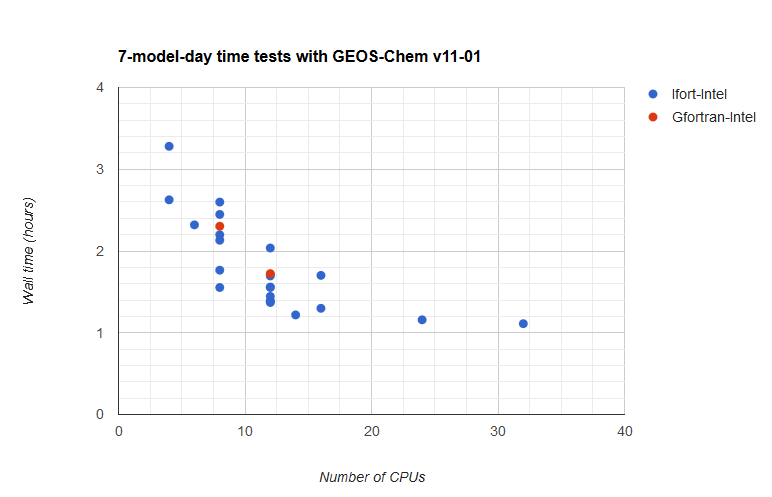
| 17:38, 29 March 2017 | V11-01-time-test results.png (file) |  |
17 KB | 7-day time tests with GEOS-Chem, 3/29/17 | 1 |
| 19:05, 27 March 2008 | Lnoxcommonblockerror.png (file) |  |
17 KB | PNG file showing the common block error for the Lightning NOx. | 1 |
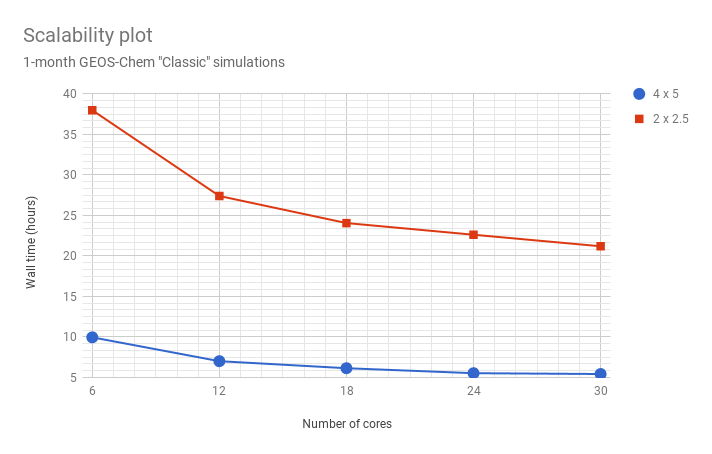
| 17:47, 18 June 2018 | Scalability v11-02c.png (file) |  |
19 KB | 1 | |
| 18:56, 20 December 2018 | Hemco restart error fixed emission year gc12.png (file) | 19 KB | Restart file error that happens when the emission year in HEMCO is fixed. Occurs in GEOS-Chem 12.1.0. | 1 | |
| 20:08, 21 May 2014 | Seac4rs jvalues FJXv7.pdf (file) | 22 KB | Katie Travis plot showing JACET from FAST-JX v7.0 | 1 | |
| 14:37, 22 May 2014 | Seac4rs jvalues FJXv7 v2.pdf (file) | 22 KB | Updated plot by Katie Travis | 1 | |
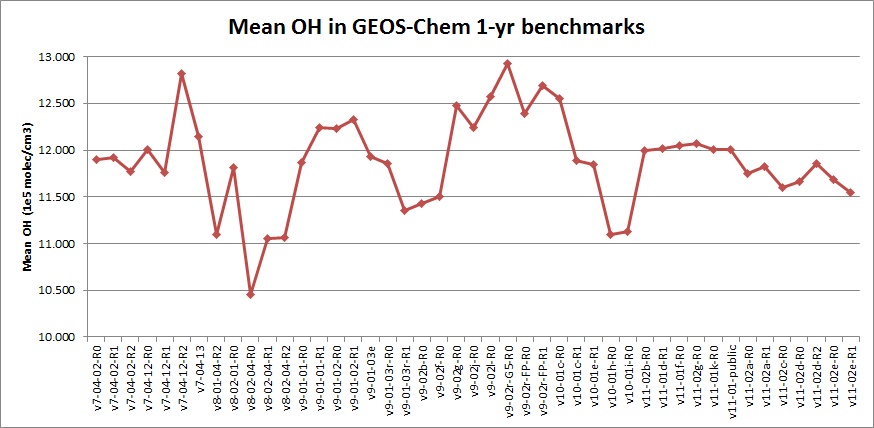
| 19:00, 15 May 2018 | Mean OH v11-02.png (file) |  |
26 KB | Mean OH thru v11-02f | 1 |
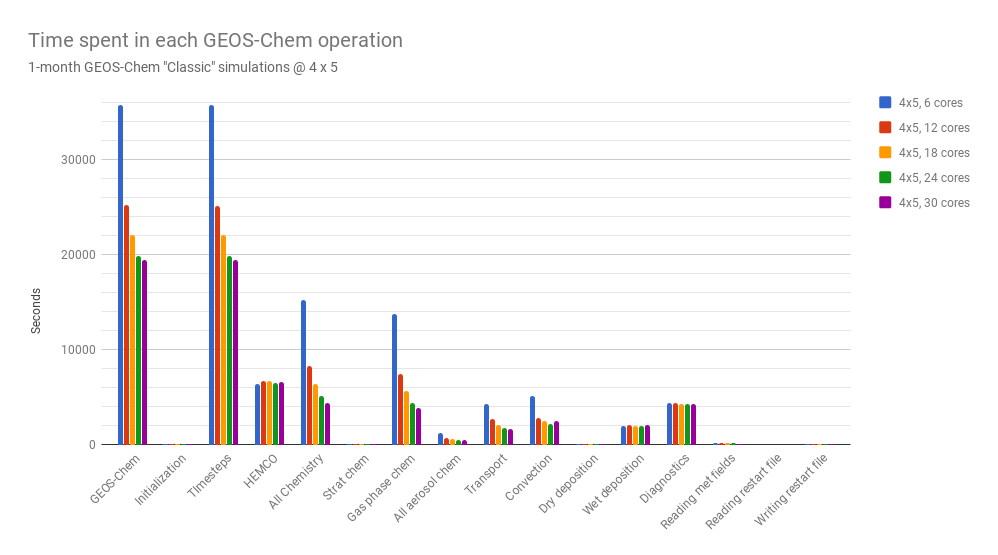
| 17:47, 18 June 2018 | Timers 4x5 v11-02c.png (file) |  |
27 KB | 1 | |
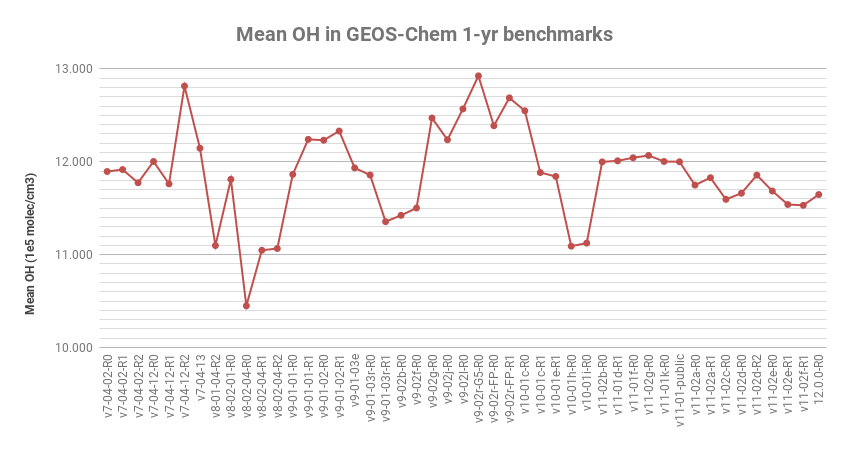
| 19:58, 10 August 2018 | GC Mean OH 12.0.0.png (file) |  |
28 KB | Corrected plot of GEOS-Chem Mean OH | 1 |
| 20:14, 14 August 2015 | Google groups 3.png (file) |  |
28 KB | Tutorial slide #3 for Google Groups interface | 1 |
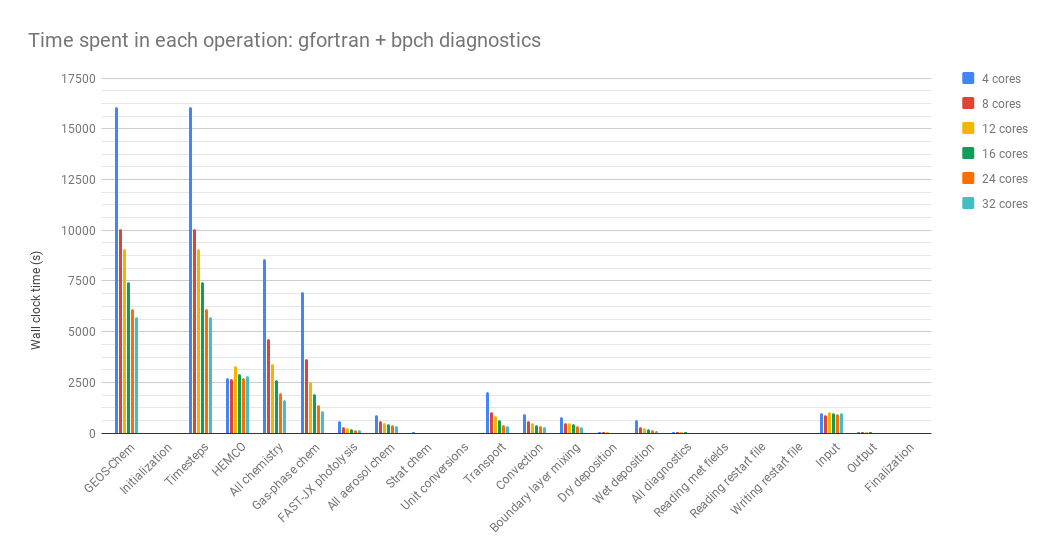
| 20:36, 16 August 2018 | Ops gf bpch 12.0.0.png (file) |  |
28 KB | Time spent in each operation, gfortran v7.1 + bpch diags | 1 |
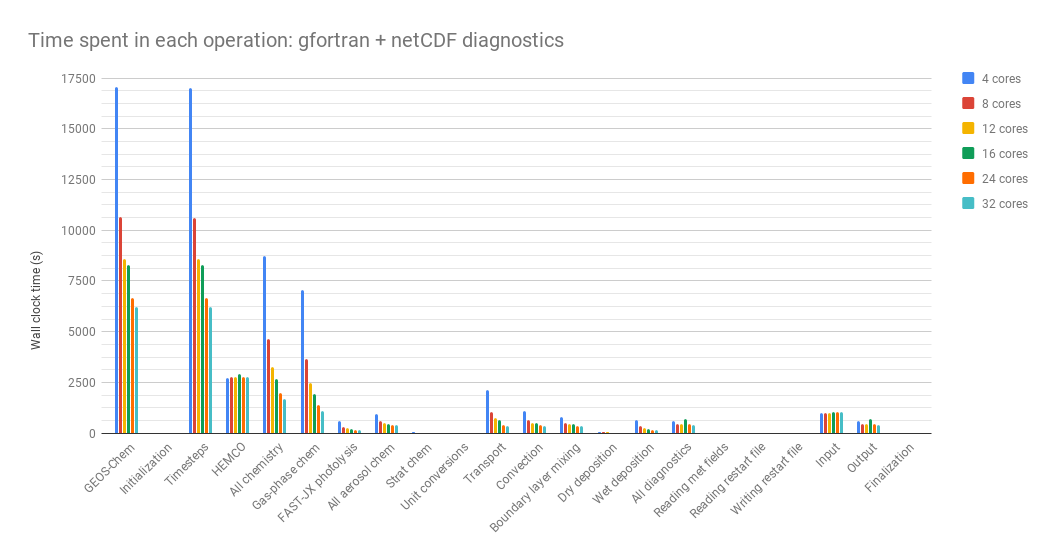
| 20:36, 16 August 2018 | Ops gf nc 12.0.0.png (file) |  |
29 KB | Time spent in each operation, gfortran 7.1 + netCDF diags | 1 |
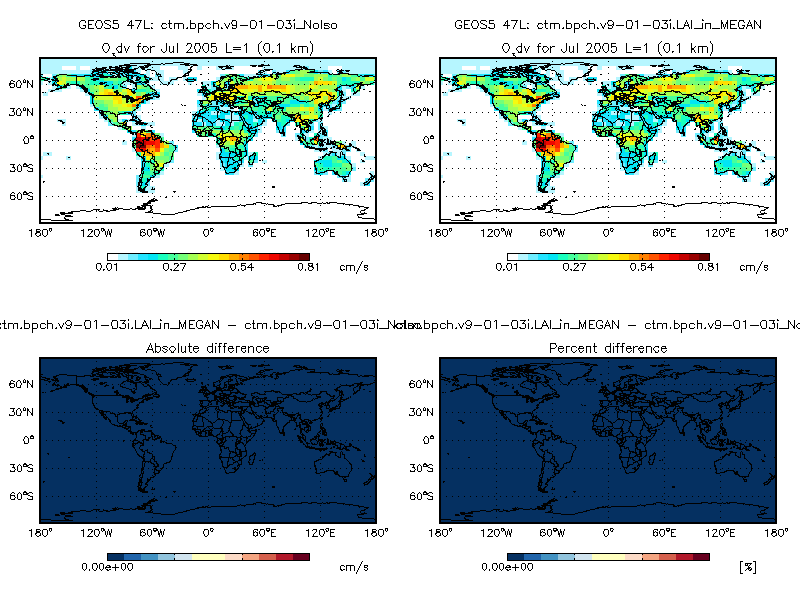
| 18:55, 13 April 2012 | Ox vd diff.png (file) |  |
29 KB | Plot of O3 dry deposition velocities, comparing GEOS-Chem v9-01-03i (using the old LAI scheme) vs. the new LAI scheme. Plots were taken from 1-month simulations. Both used the Olson 1992 land map and MODIS LAI at 0.5 x 0.5 native resolution. | 1 |
| 18:18, 17 February 2017 | Depvel figure 1.png (file) |  |
30 KB | Figure # 1 from Brian Boys (smaller) | 1 |
| 21:14, 31 July 2015 | Page is under construction.jpg (file) |  |
30 KB | Jpeg showing the page is under construction ... a nice touch | 1 |
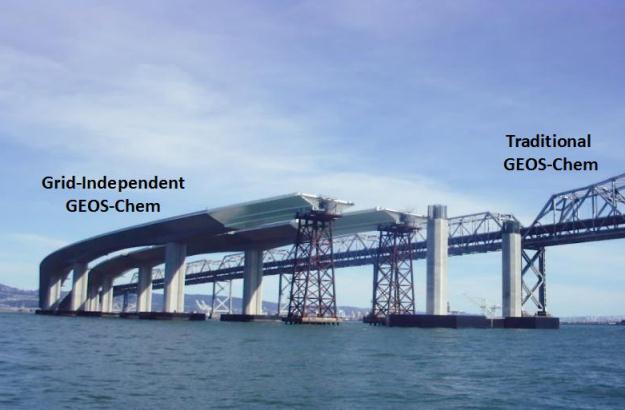
| 16:58, 14 December 2012 | GIGC Bridge.jpg (file) |  |
31 KB | Diagram showing how we are building the new bridge (GIGC) next to the old bridge (existing GC). | 1 |
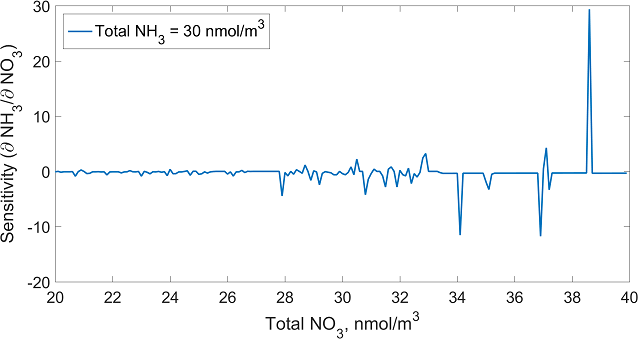
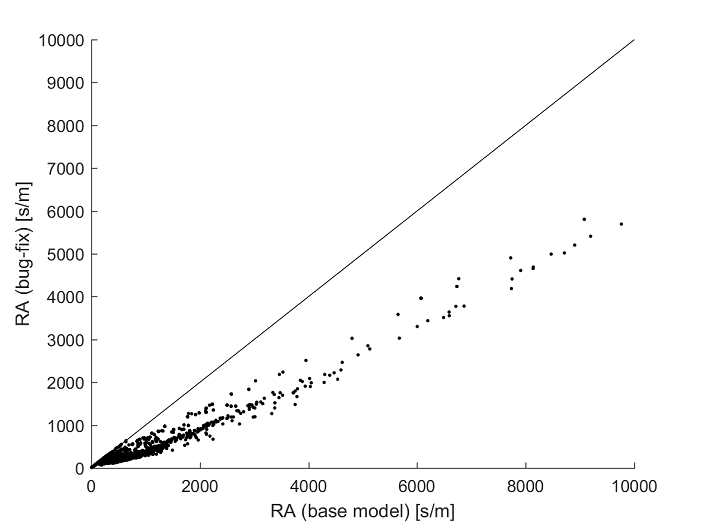
| 20:55, 23 January 2017 | ISORROPIASensitivity.png (file) |  |
31 KB | Sensitivity of gas-phase NO3 to total NO3, by Seb Eastham | 1 |
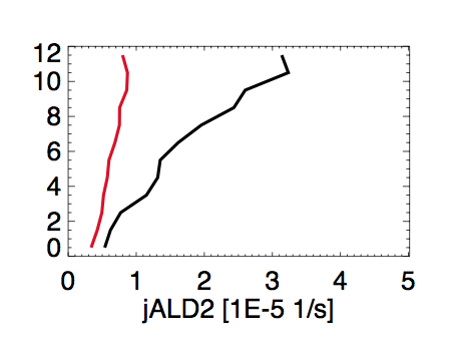
| 18:54, 27 May 2014 | ALD2 photolysis.png (file) |  |
34 KB | Plot made by Chris Chan Miller showing the discrepancy between observed and modeled J(ALD2). | 1 |
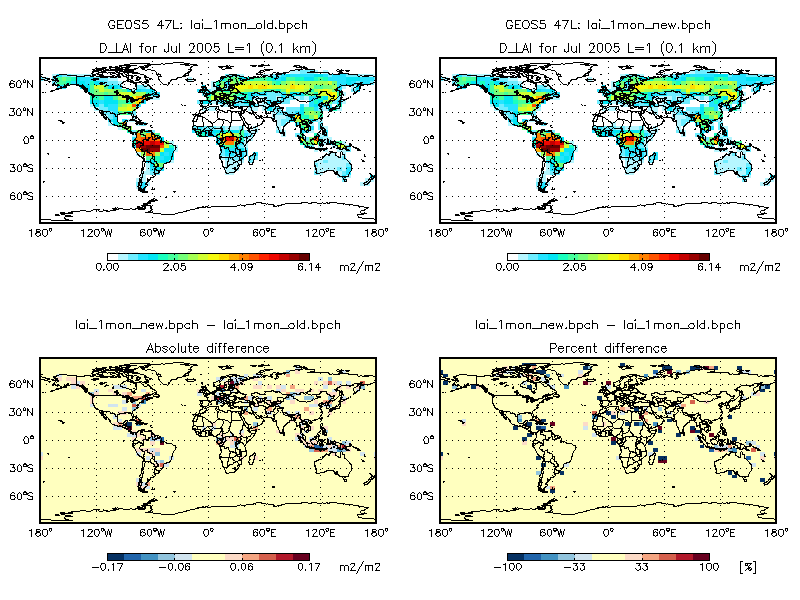
| 18:20, 12 April 2012 | Lai diff.png (file) |  |
34 KB | Shows the difference in LAI between GEOS-Chem v9-01-03i and the new LAI scheme implemented with modis_lai_mod.F90. | 1 |
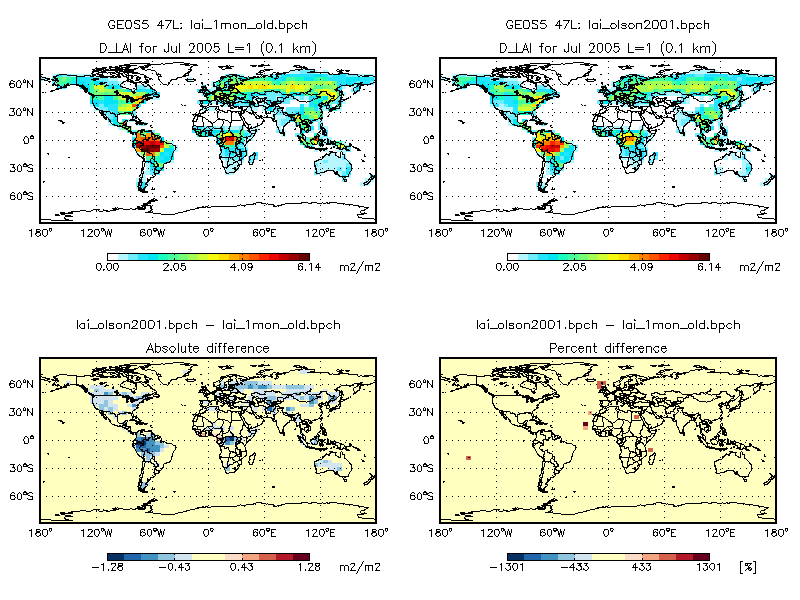
| 18:13, 13 April 2012 | Lai olson2001 diff.png (file) |  |
35 KB | Plot showing the difference of MODIS LAI (regridded from 0.25 x 0.25) to MODIS LAI regridded from 1 x 1 resolution. | 1 |
| 20:38, 23 November 2011 | Ethane caribic comparison.gif (file) |  |
36 KB | Plot showing underestimate of RETRO C2H6 emissions by Bess Corbitt | 1 |
| 18:53, 23 January 2020 | Gc issues.png (file) |  |
36 KB | Updated screenshot for Github issues on geos-chem repo | 1 |
| 16:21, 2 December 2016 | Obsolete.jpg (file) |  |
39 KB | Obsolete jpg | 1 |
| 18:18, 17 February 2017 | Depvel figure 3.png (file) |  |
39 KB | Figure #3 from Brian Boys | 1 |
| 18:18, 17 February 2017 | Depvel figure 2.png (file) |  |
40 KB | Figure #2 from Brian Boys | 1 |
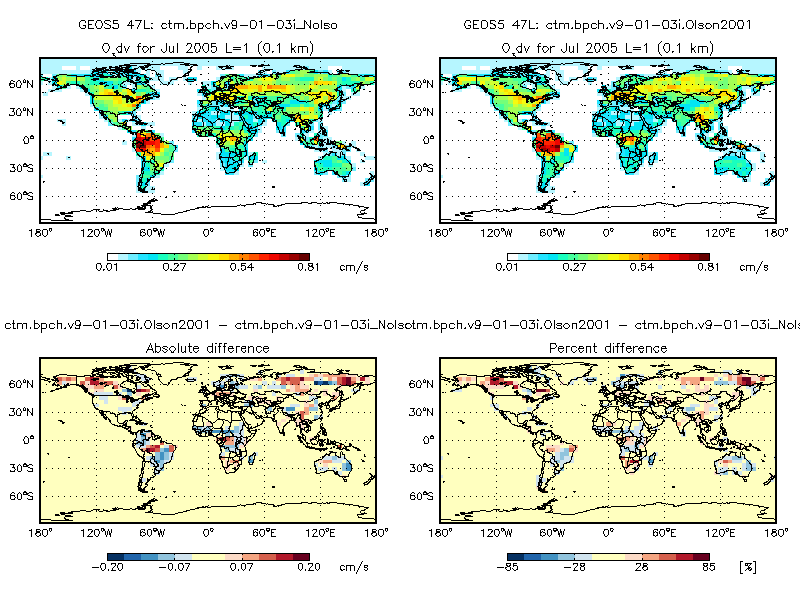
| 18:54, 13 April 2012 | Ox vd Olson2001 diff.png (file) |  |
40 KB | Difference of O3 drydep velocities generated by GEOS-Chem v9-01-03i (using Olson 1992 land map) and with the Olson 20001 land map. Note that there are signfiicant differences. | 1 |
| 18:38, 9 September 2019 | Gcpy issue.png (file) |  |
41 KB | GCPy issues page on github | 1 |
| 21:20, 18 May 2015 | Appearances2.png (file) | 42 KB | Tutorial for setting the appearance of your wiki session #2 | 1 |
First page |
Previous page |
Next page |
Last page |