File list
This special page shows all uploaded files.
First page |
Previous page |
Next page |
Last page |
| Date | Name | Thumbnail | Size | Description | Versions |
|---|---|---|---|---|---|
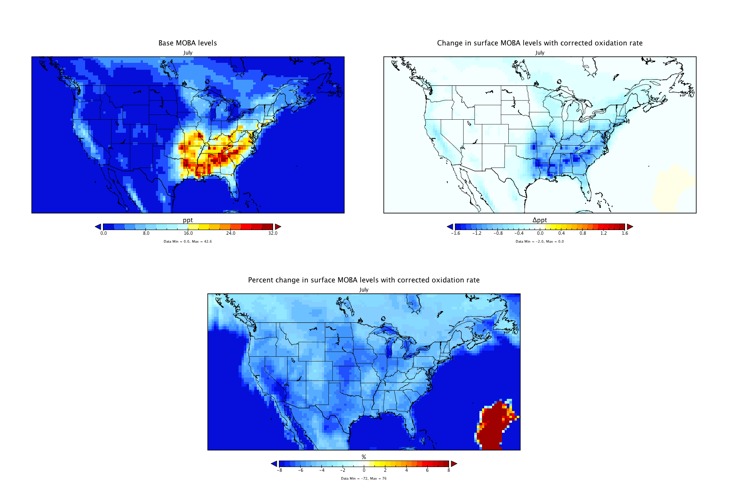
| 22:03, 8 January 2016 | Will porter.png (file) |  |
178 KB | Shows impact of a syntax error in globchem.dat for the MOBA rxn rate | 1 |
| 16:46, 10 July 2012 | V9-01-03o.compare.pdf (file) | 927 KB | Document from Lee Murray showing bromine concentration differences | 1 | |
| 19:59, 20 December 2016 | V11-01 Prov Release 20Dec2016.pdf (file) | 72 KB | Newsletter for GEOS-Chem v11-01 provisional release | 1 | |
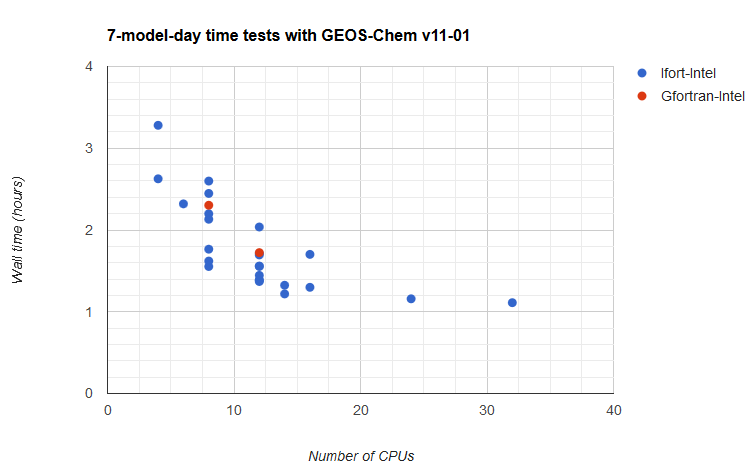
| 17:38, 29 March 2017 | V11-01-time-test results.png (file) |  |
17 KB | 7-day time tests with GEOS-Chem, 3/29/17 | 1 |
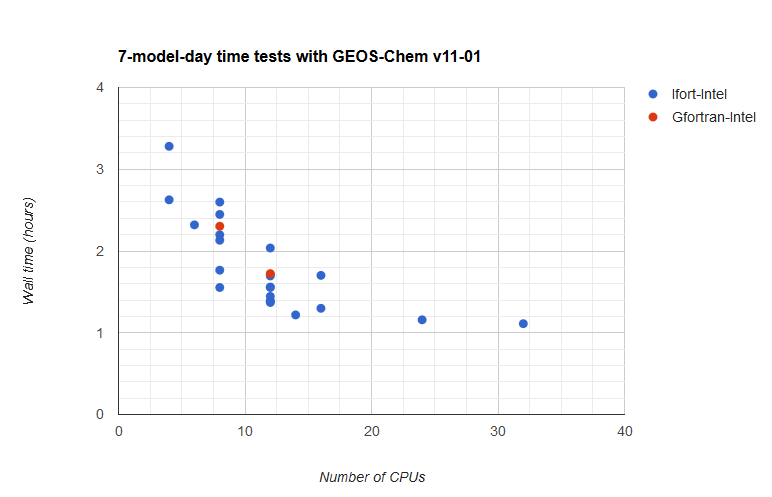
| 15:42, 10 March 2017 | V11-01-time-test-results.png (file) |  |
17 KB | Timing test results updated 10 Mar 2017 | 1 |
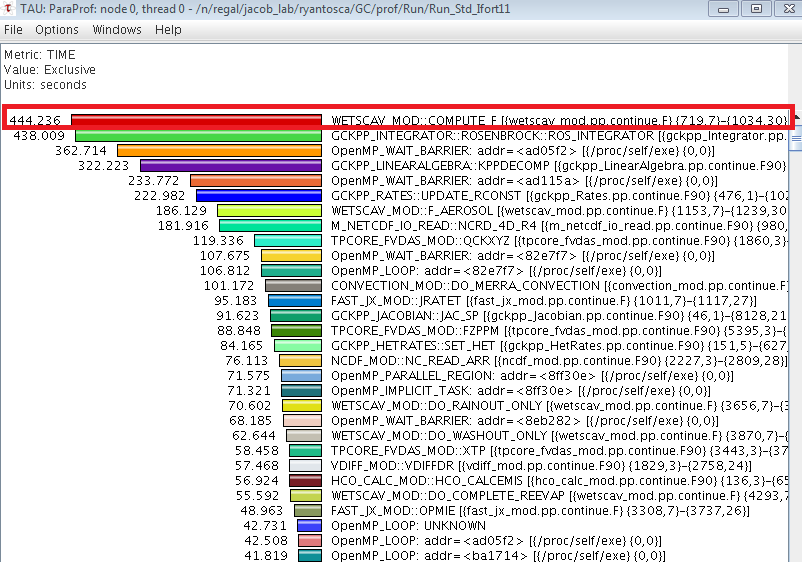
| 21:43, 8 February 2017 | V11-01-thread0.png (file) |  |
48 KB | Profiling plot from TAU showing bottleneck in v11-01 convection module | 1 |
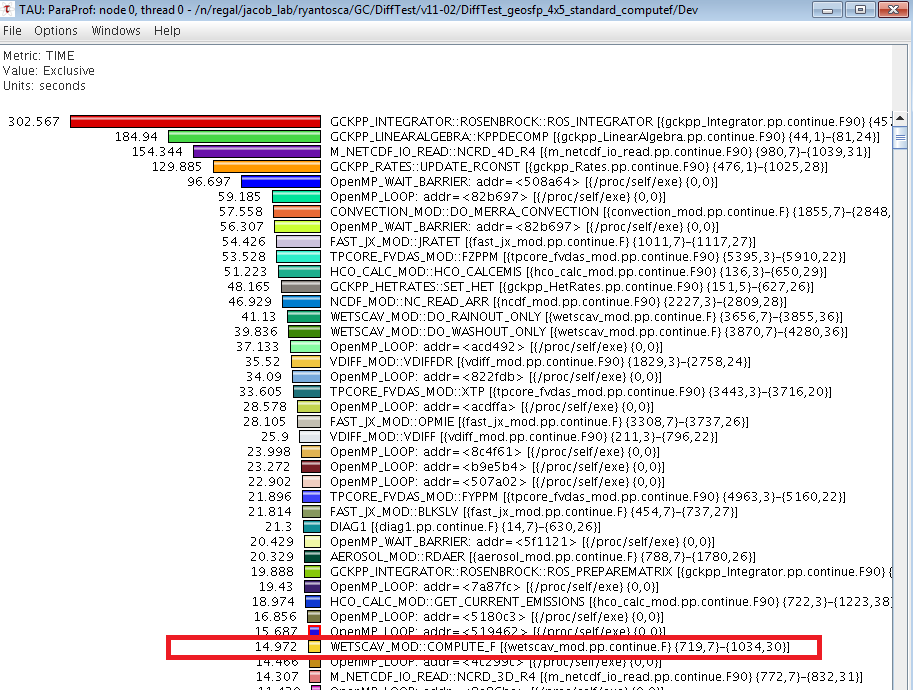
| 21:44, 8 February 2017 | V11-01-thread0-parallelized.png (file) |  |
61 KB | Plot from the TAU profiler showing how parallelizing the call to COMPUTE_F removes a computational bottleneck. | 1 |
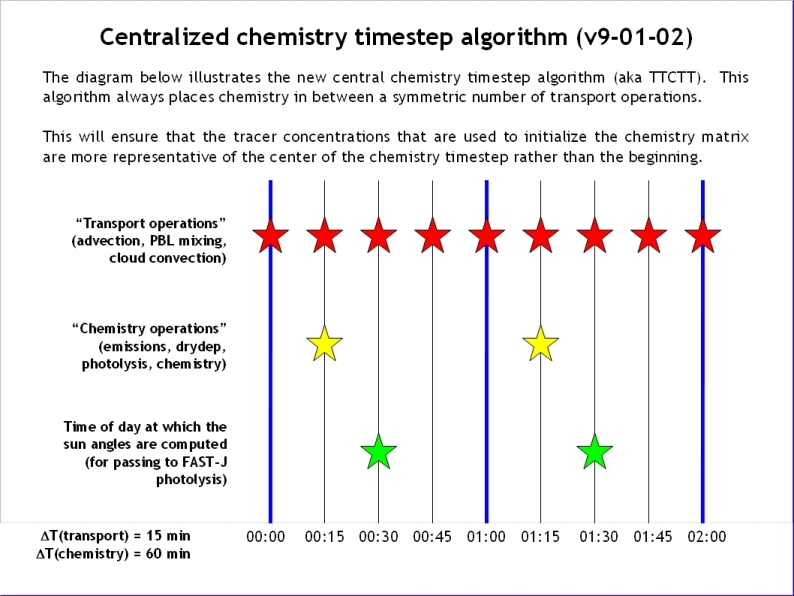
| 17:11, 20 October 2011 | Ttctt configuration.jpg (file) |  |
183 KB | v9-01-02+ chem timestepping plot | 1 |
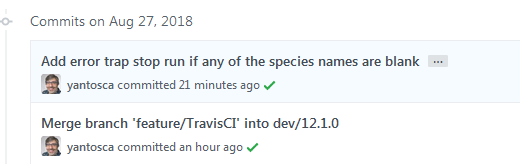
| 16:29, 27 August 2018 | Travis ci.png (file) |  |
12 KB | Sample of Github commit with green checkmark | 1 |
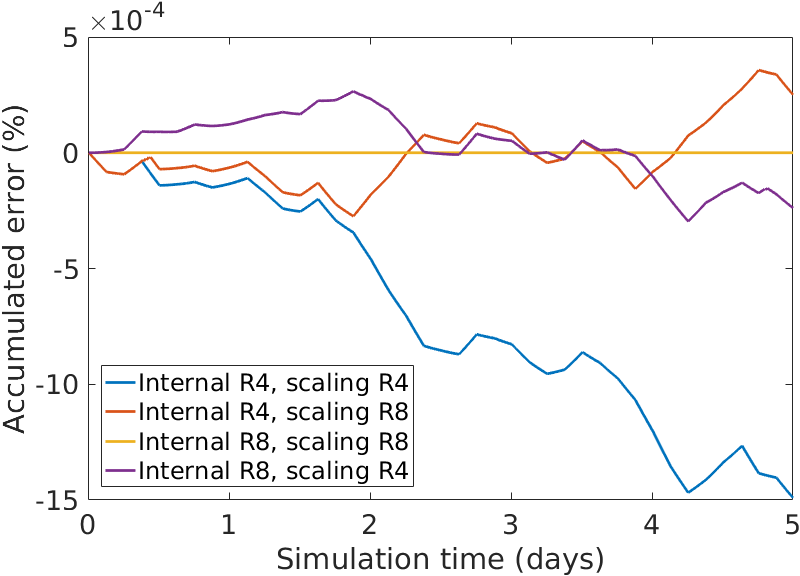
| 19:33, 23 February 2017 | Transport error v3 gchp.png (file) | 50 KB | Shows transport error using various combinations of flexible precision in GCHP. | 1 | |
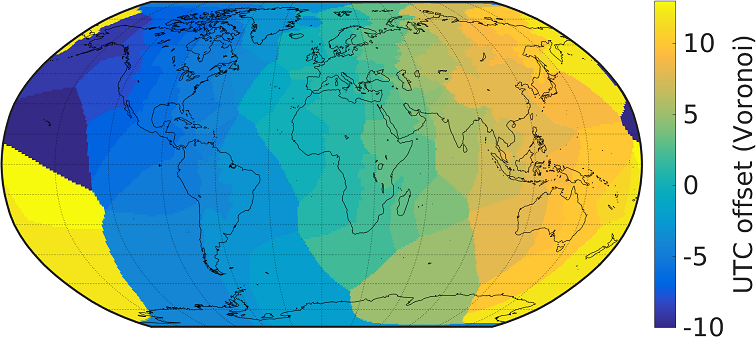
| 18:39, 4 January 2017 | Timezones Voronoi.png (file) |  |
217 KB | Plot from Seb Eastham showing the new Voronoi timezones for HEMCO. | 1 |
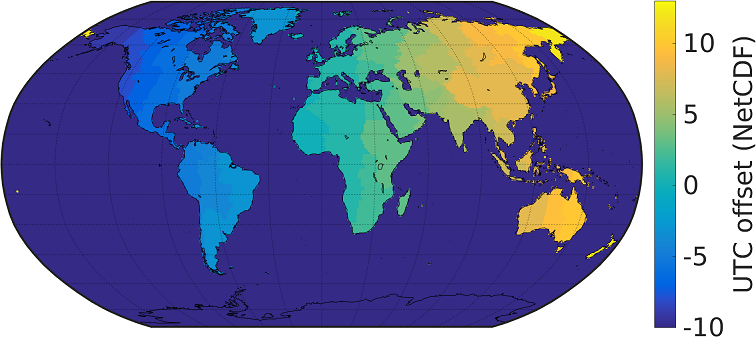
| 18:39, 4 January 2017 | Timezones V11-01 Default.png (file) |  |
177 KB | Plot from Seb Eastham showing v11-01 default HEMCO timezones | 1 |
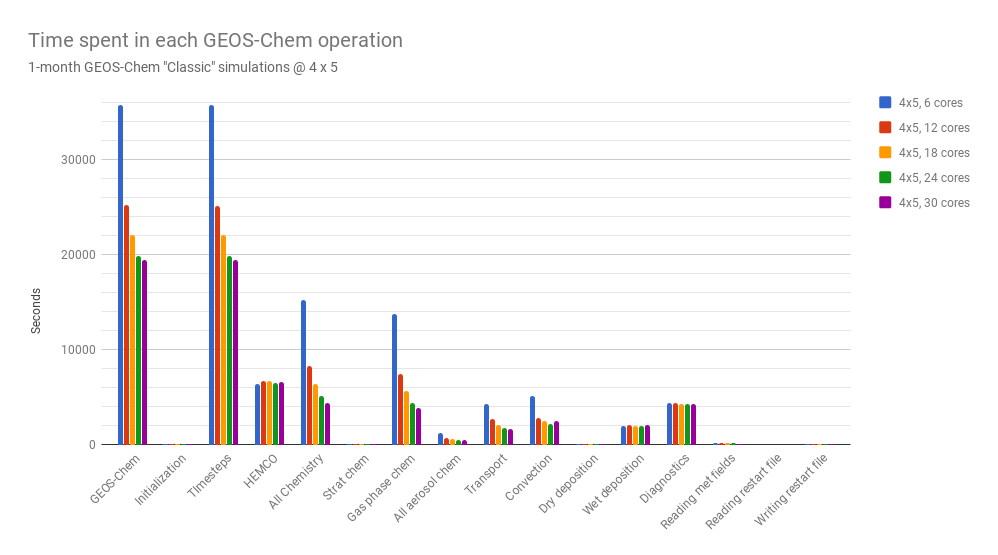
| 17:47, 18 June 2018 | Timers 4x5 v11-02c.png (file) |  |
27 KB | 1 | |
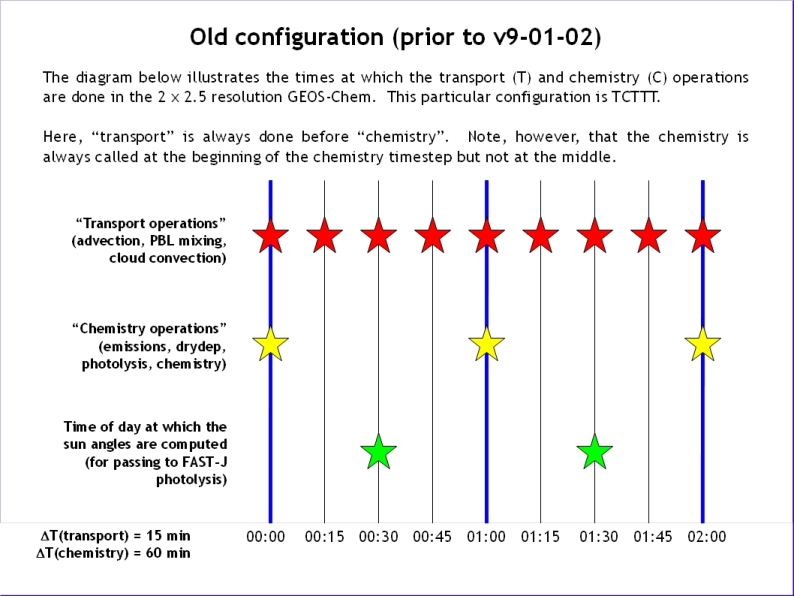
| 17:10, 20 October 2011 | Tcttt configuration.jpg (file) |  |
176 KB | pre v9-01-02 chem timestepping | 1 |
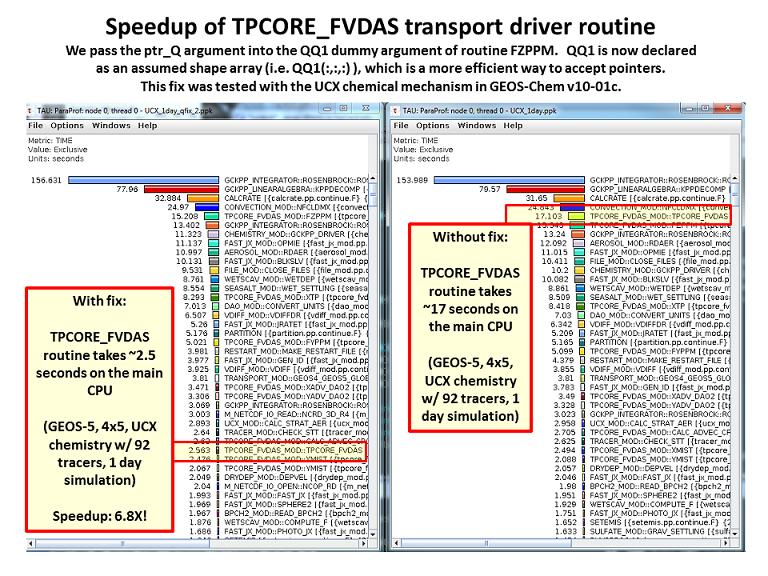
| 20:53, 16 April 2014 | TPCORE FVDAS Speedup.png (file) |  |
286 KB | Image illustrating the speedup obtained by passing ptr_Q pointer argument to an assumed-shape dummy argument qq1(:,:,:). | 1 |
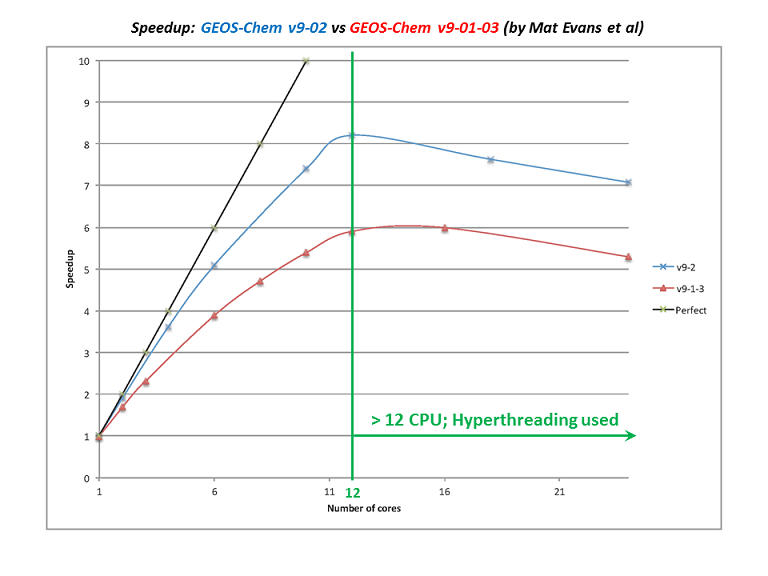
| 15:42, 19 November 2013 | Speedup v9-02.png (file) |  |
53 KB | Shows the speedup of GEOS-Chem v9-02 vs v9-01-03. | 1 |
| 14:53, 16 January 2020 | Spack 2 thumbnail.png (file) |  |
16 KB | Thumbnail for Spack tutorial #2 video | 1 |
| 14:53, 16 January 2020 | Spack 1 thumbnail.png (file) |  |
15 KB | Thumbnail for Spack tutorial #1 video | 1 |
| 21:35, 6 January 2016 | Soa svpoa problems.pdf (file) | 193 KB | PDF of Prasad Kasibhatla's plots from an SOA/SVPOA simulation. | 1 | |
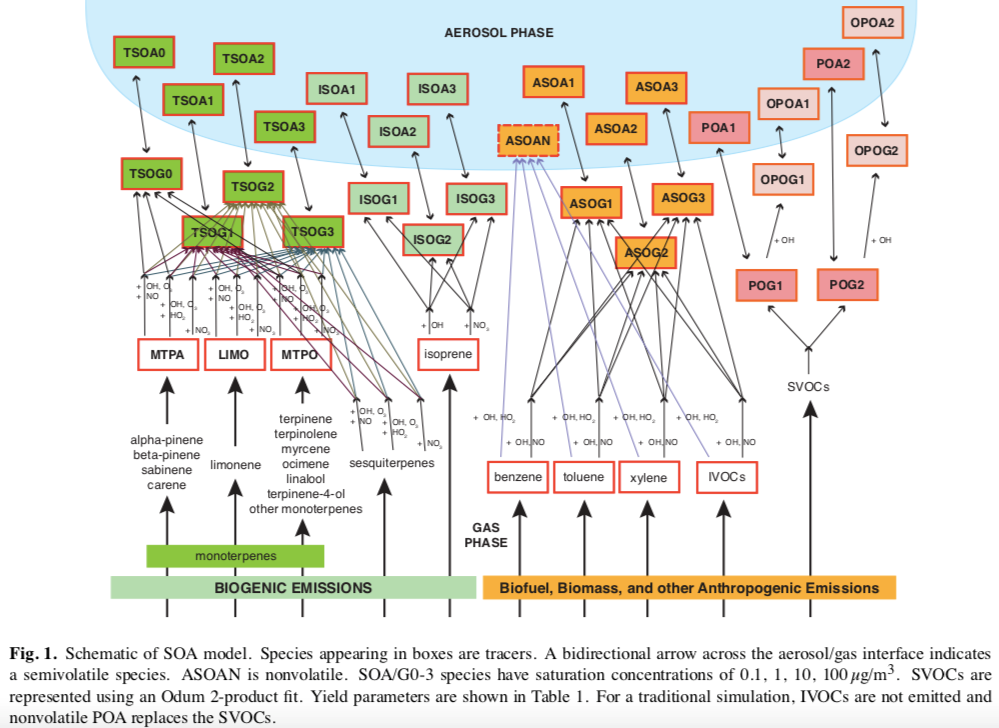
| 15:32, 23 January 2019 | Soa lumping figure.png (file) |  |
265 KB | Describes the complex SOA lumping in GEOS-Chem, following Pye et al 2010. | 1 |
| 14:37, 22 May 2014 | Seac4rs jvalues FJXv7 v2.pdf (file) | 22 KB | Updated plot by Katie Travis | 1 | |
| 20:08, 21 May 2014 | Seac4rs jvalues FJXv7.pdf (file) | 22 KB | Katie Travis plot showing JACET from FAST-JX v7.0 | 1 | |
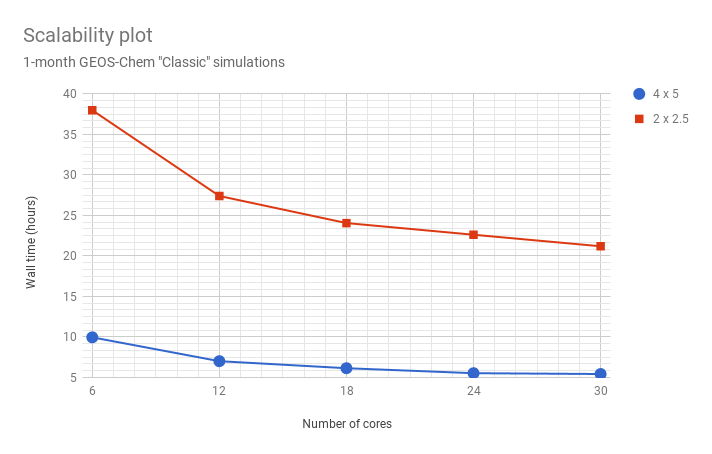
| 17:47, 18 June 2018 | Scalability v11-02c.png (file) |  |
19 KB | 1 | |
| 20:24, 16 August 2018 | Scalability 7day 12.0.0.png (file) |  |
50 KB | GEOS-Chem 12.0.0 scalability | 1 |
| 20:29, 13 May 2015 | README GEOS FP 5110 UPGRADE.pdf (file) | 68 KB | README about the upgrade to GEOS-5.11.0 | 1 | |
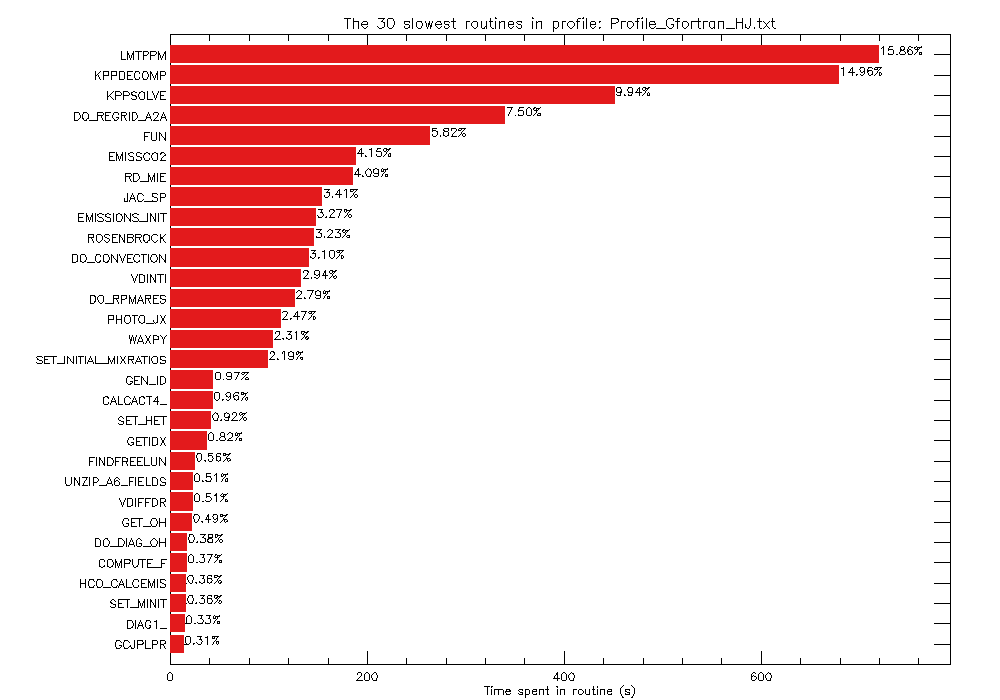
| 20:18, 15 December 2016 | Plot gprof output.png (file) |  |
14 KB | Example plot from the GAMAP "plot_gprof.pro" routine. | 1 |
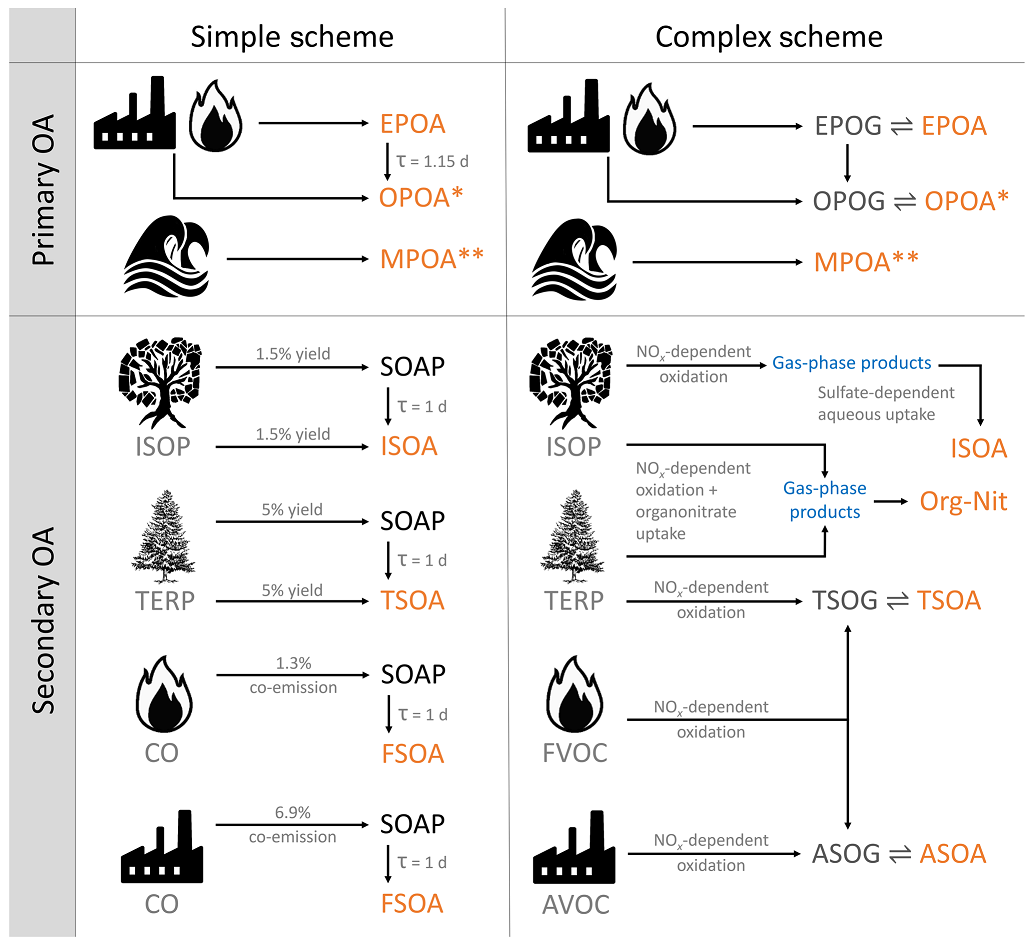
| 19:24, 18 May 2020 | Pai et al 2020 simple soa.png (file) |  |
196 KB | Sidhant Pai et al 2020 description of the Simple SOA scheme | 1 |
| 21:14, 31 July 2015 | Page is under construction.jpg (file) |  |
30 KB | Jpeg showing the page is under construction ... a nice touch | 1 |
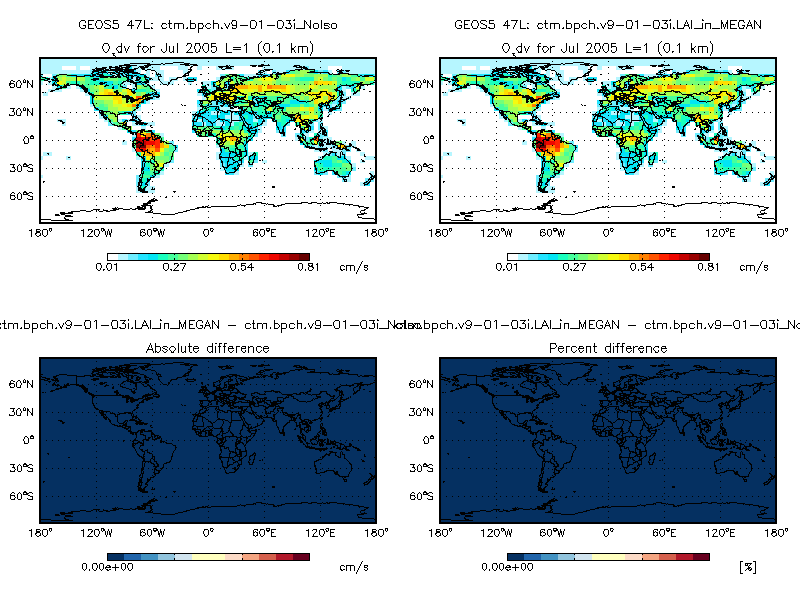
| 18:55, 13 April 2012 | Ox vd diff.png (file) |  |
29 KB | Plot of O3 dry deposition velocities, comparing GEOS-Chem v9-01-03i (using the old LAI scheme) vs. the new LAI scheme. Plots were taken from 1-month simulations. Both used the Olson 1992 land map and MODIS LAI at 0.5 x 0.5 native resolution. | 1 |
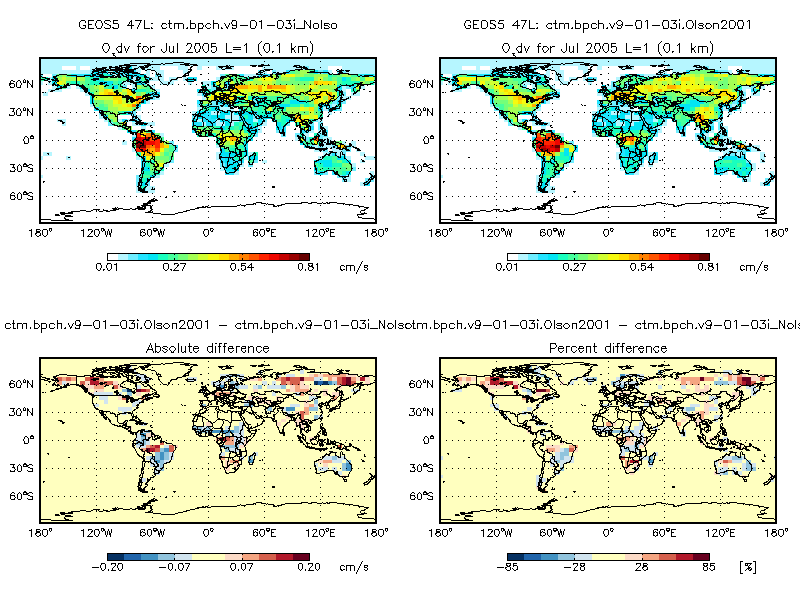
| 18:54, 13 April 2012 | Ox vd Olson2001 diff.png (file) |  |
40 KB | Difference of O3 drydep velocities generated by GEOS-Chem v9-01-03i (using Olson 1992 land map) and with the Olson 20001 land map. Note that there are signfiicant differences. | 1 |
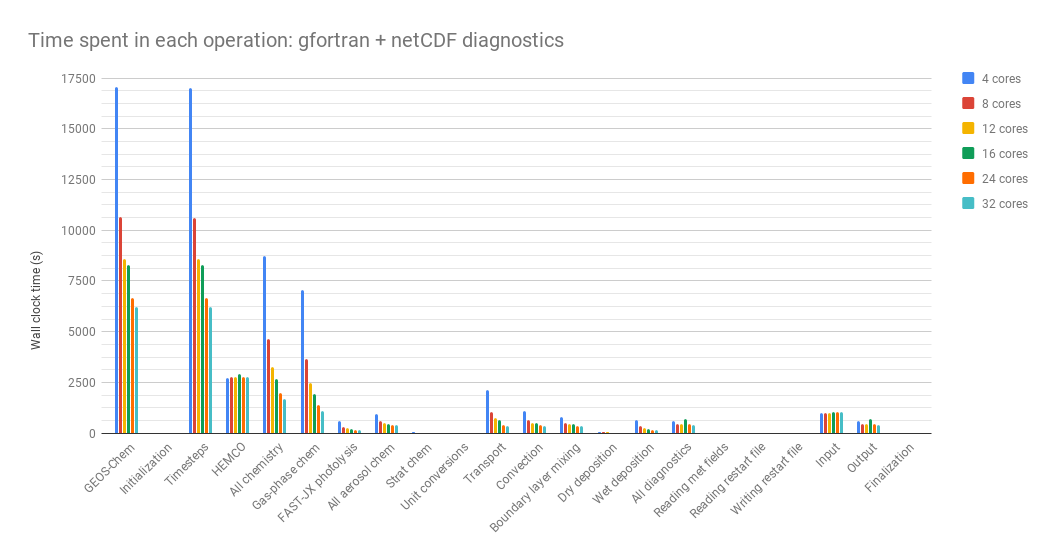
| 20:36, 16 August 2018 | Ops gf nc 12.0.0.png (file) |  |
29 KB | Time spent in each operation, gfortran 7.1 + netCDF diags | 1 |
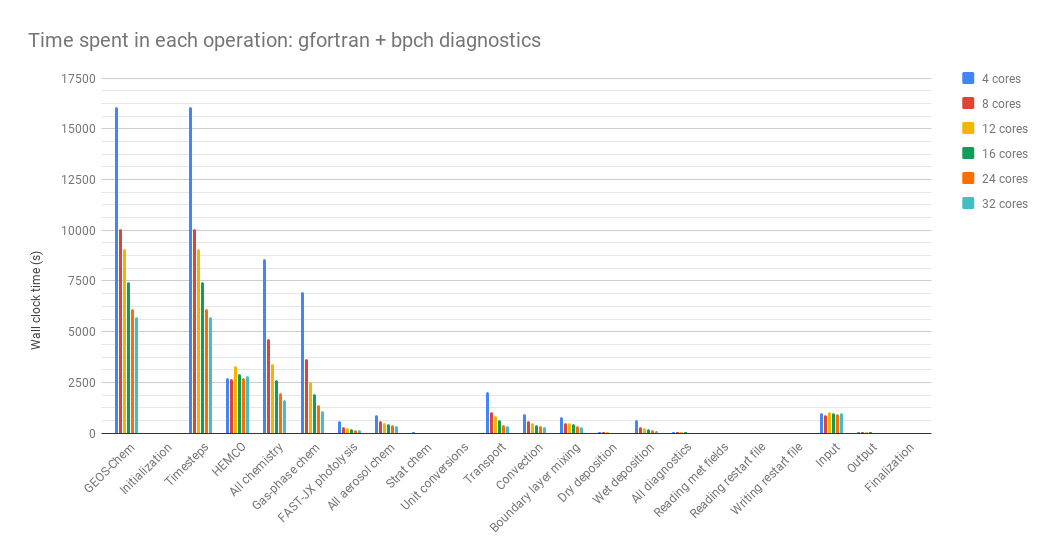
| 20:36, 16 August 2018 | Ops gf bpch 12.0.0.png (file) |  |
28 KB | Time spent in each operation, gfortran v7.1 + bpch diags | 1 |
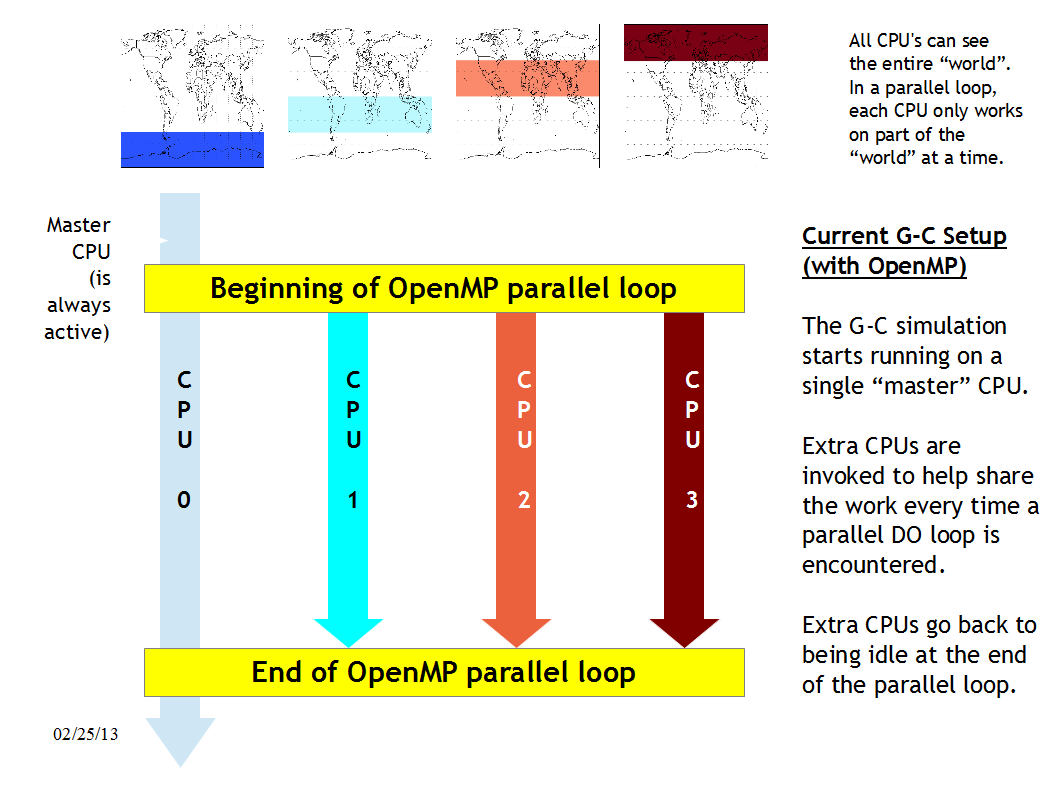
| 16:43, 25 February 2013 | OpenMP Demo.png (file) |  |
119 KB | Demo of how OPENMP parallelization works. | 1 |
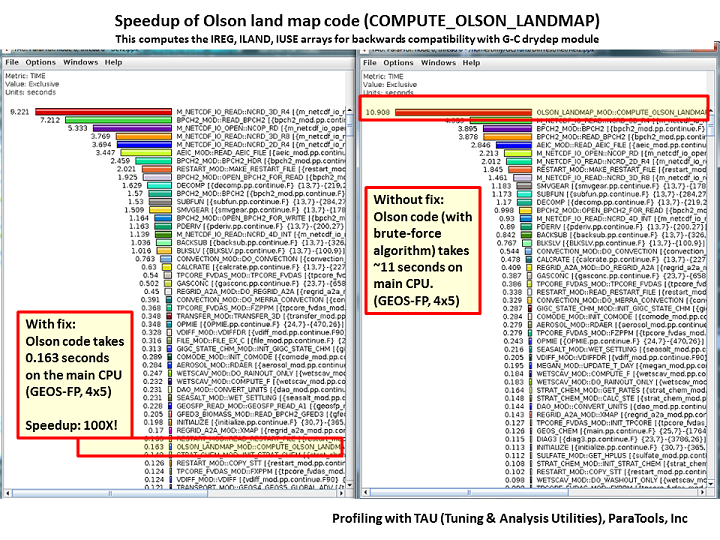
| 14:15, 21 March 2014 | Olson Speedup.png (file) |  |
287 KB | Demonstrates the speedup in the Olson landmap code. Visualization generated with the TAU profiler. | 1 |
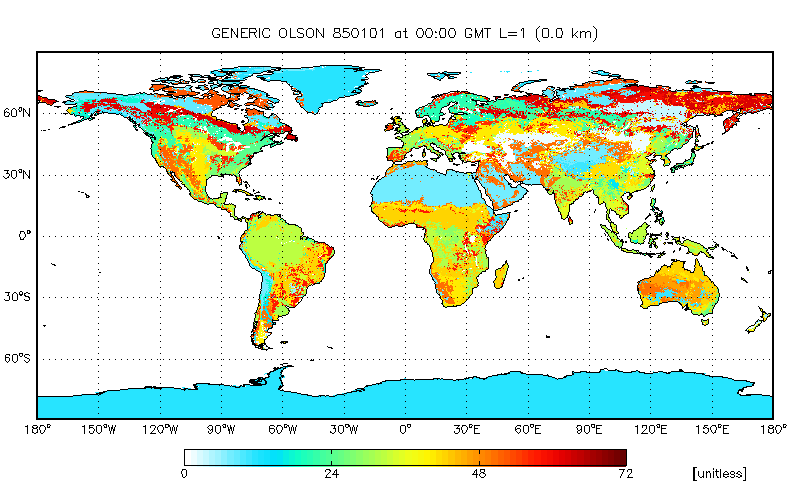
| 14:52, 23 March 2012 | Olson2001.png (file) |  |
72 KB | Olson map, 2001 | 1 |
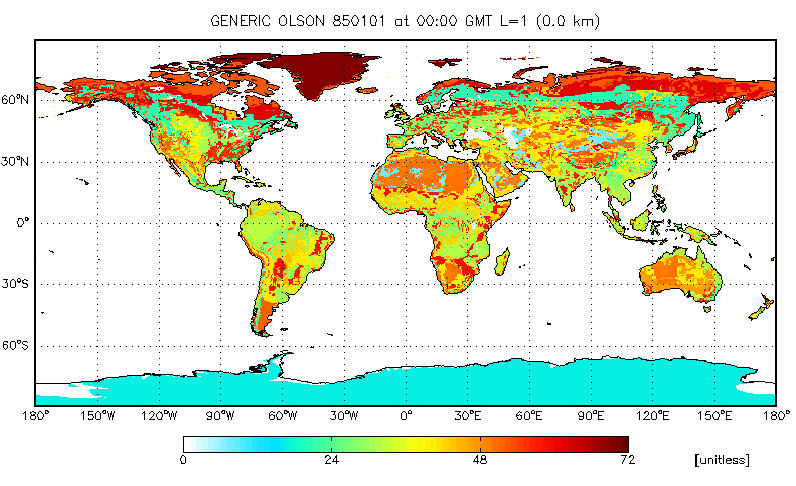
| 14:52, 23 March 2012 | Olson1992.png (file) |  |
68 KB | Olson map, 1992 (now w/ 72 colors) | 2 |
| 16:21, 2 December 2016 | Obsolete.jpg (file) |  |
39 KB | Obsolete jpg | 1 |
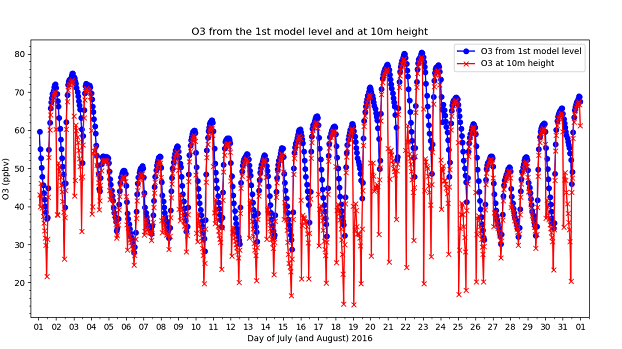
| 20:12, 23 August 2019 | O3 10m.png (file) |  |
127 KB | Plot of O3 at first level and at 10m | 1 |
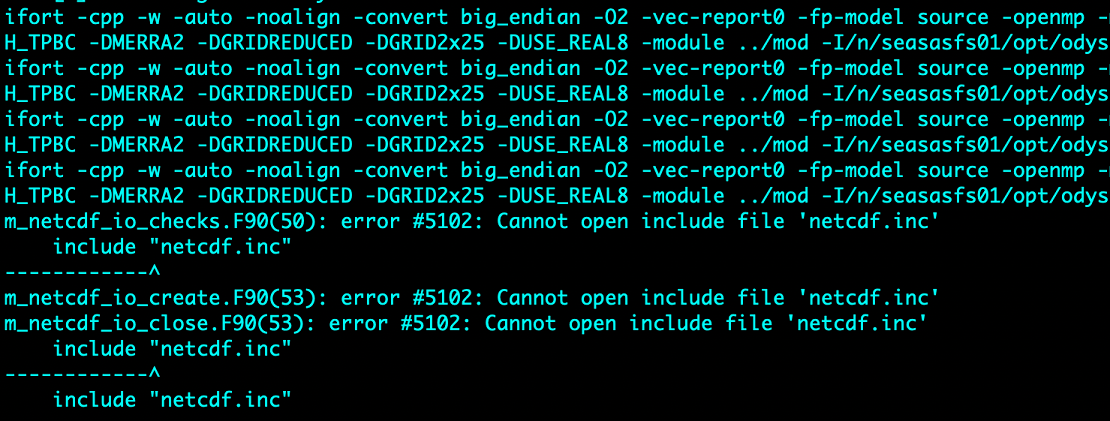
| 19:28, 9 August 2019 | Netcdf inc not found.png (file) |  |
279 KB | Example of an error when netCDF is not loaded into your Unix environment. | 1 |
| 21:15, 14 November 2017 | Netcdf Diagnostics.pdf (file) | 308 KB | NetCDF diagnostic overview document | 1 | |
| 20:04, 27 November 2017 | NetCDF diagnostic update.pdf (file) | 1.39 MB | Validation of the netCDF diagnostics in GC-Classic | 1 | |
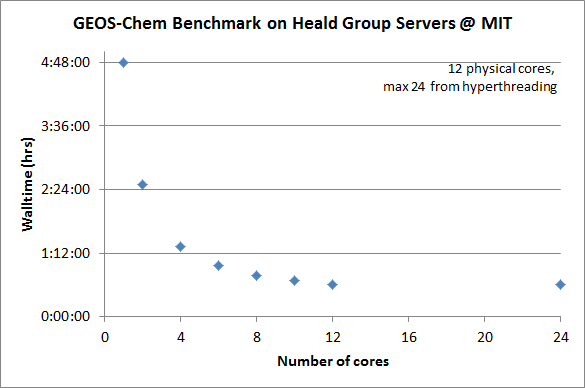
| 15:52, 17 April 2012 | Mit gc benchmark.png (file) |  |
11 KB | Shows benchmarking results done by Colette Heald @ MIT using 1-24 CPUs. | 1 |
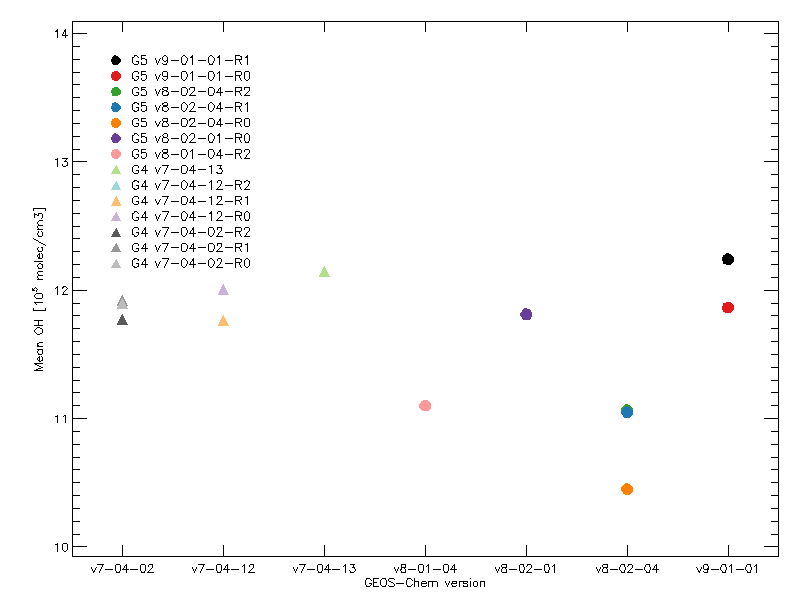
| 20:52, 8 June 2011 | Mean oh 1yr v9.png (file) |  |
10 KB | Upload file with version 9 OH on the plot | 1 |
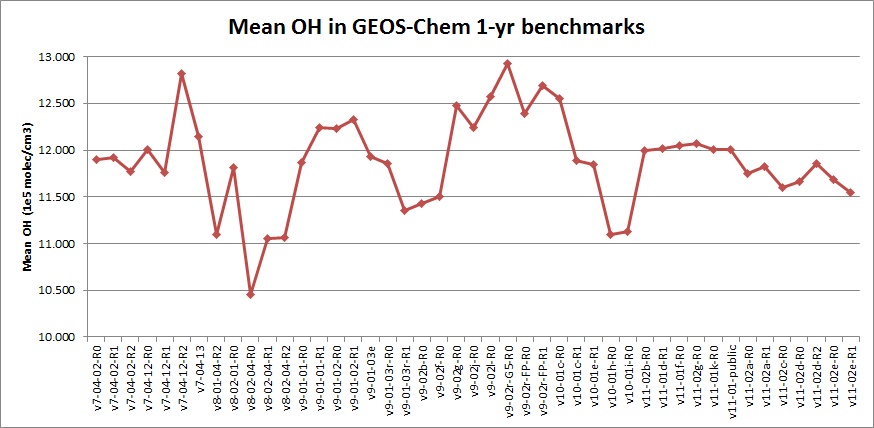
| 19:00, 15 May 2018 | Mean OH v11-02.png (file) |  |
26 KB | Mean OH thru v11-02f | 1 |
| 20:54, 22 February 2017 | Mass cons prec8 8months.png (file) |  |
46 KB | Evolution of tracer mass (geosfp_2x25_masscons) with PRECISION=8 and TURBDAY PBL mixing, Jan thru Aug 2013. | 1 |
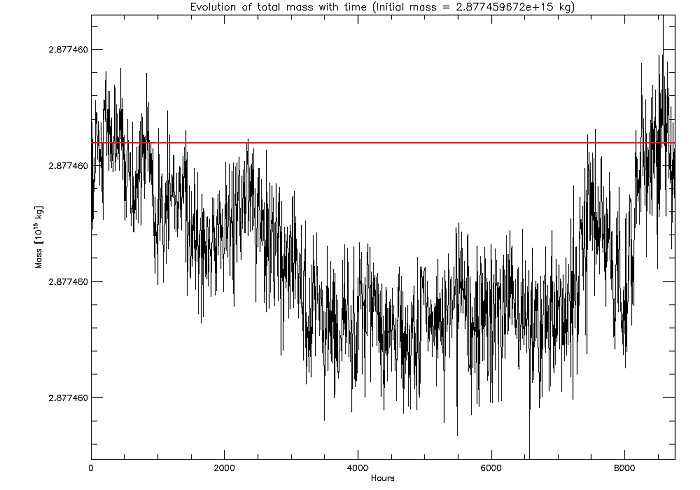
| 15:07, 24 February 2017 | Mass cons prec8 1yr vdiff.png (file) |  |
45 KB | Evolution of tracer mass vs. time for a geosfp_2x25_masscons simulation (year 2013) with PRECISION=8 and VDIFF PBL mixing. | 1 |
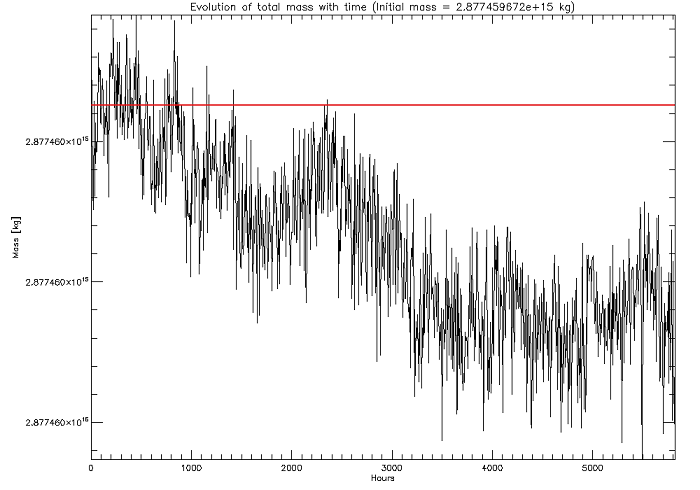
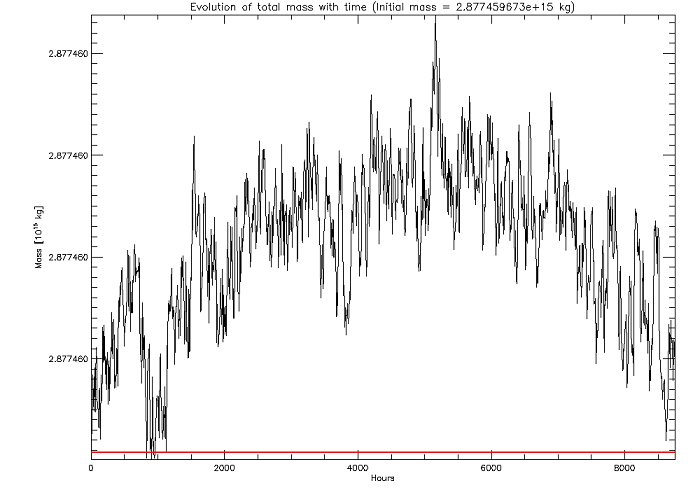
| 21:54, 22 February 2017 | Mass cons prec8 1yr.png (file) |  |
46 KB | Evolution of tracer mass with time from a geosfp_2x25_masscons simulation using PRECISION=8 and TURBDAY PBL mixing for 2013. | 1 |
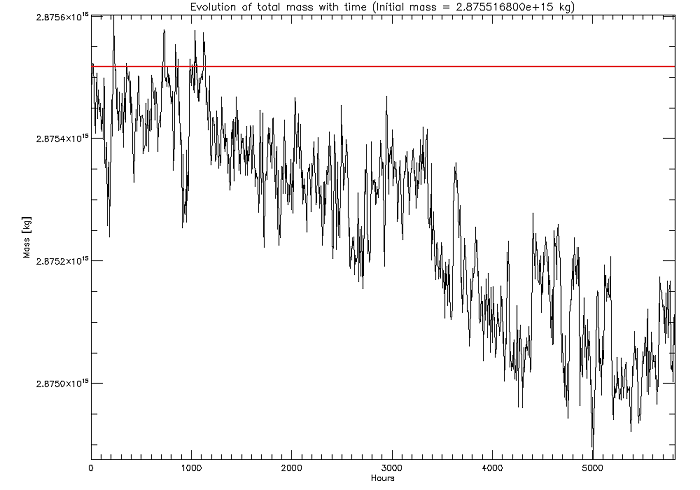
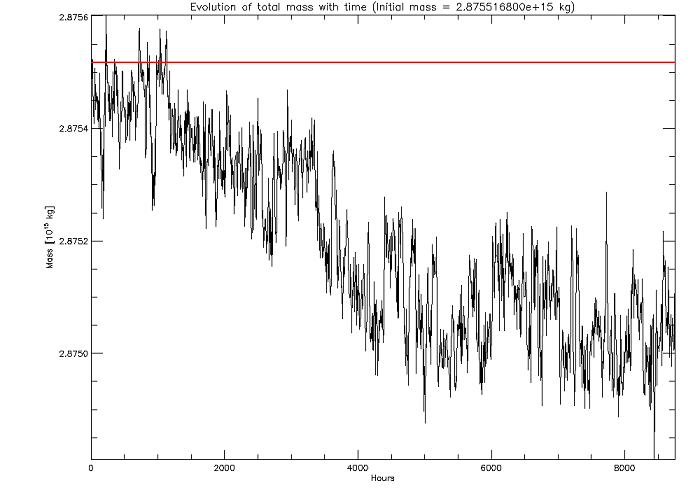
| 20:52, 22 February 2017 | Mass cons prec4 8months.png (file) |  |
44 KB | Evolution of total mass w/ time (geosfp_2x25_masscons, with PRECISION=4 and TURBDAY PBL), Jan thru Aug 2013. | 1 |
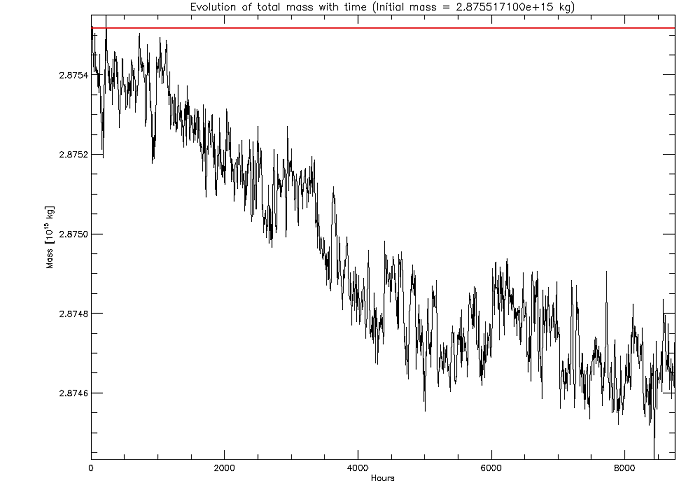
| 15:07, 24 February 2017 | Mass cons prec4 1yr vdiff.png (file) |  |
43 KB | Evolution of tracer mass vs. time for a geosfp_2x25_masscons simulation (year 2013) with PRECISION=4 and VDIFF PBL mixing. | 1 |
| 20:53, 23 February 2017 | Mass cons prec4 1yr.png (file) |  |
43 KB | Evolution of tracer mass with time from a geosfp_2x25_masscons simulation for 2013. | 1 |
First page |
Previous page |
Next page |
Last page |