File:V10-01 paranox tests.png
From Geos-chem
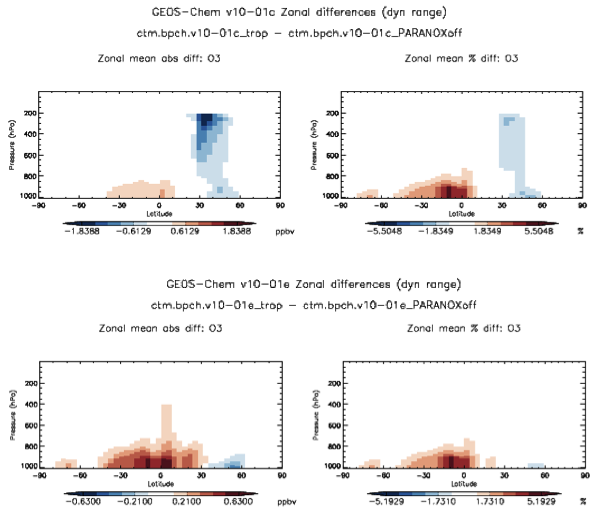
Revision as of 17:46, 1 December 2014 by Melissa Payer (Talk | contribs) (Zonal difference plots showing O3 from 7-day simulations with PARANOX turned off and on. In v10-01c, we see loss of O3 in the middle/upper troposphere. The implementation of PARANOX in HEMCO (v10-01e) corrects this issue.)
No higher resolution available.
V10-01_paranox_tests.png (600 × 513 pixels, file size: 84 KB, MIME type: image/png)
Zonal difference plots showing O3 from 7-day simulations with PARANOX turned off and on. In v10-01c, we see loss of O3 in the middle/upper troposphere. The implementation of PARANOX in HEMCO (v10-01e) corrects this issue.
File history
Click on a date/time to view the file as it appeared at that time.
| Date/Time | Thumbnail | Dimensions | User | Comment | |
|---|---|---|---|---|---|
| current | 17:50, 1 December 2014 | | 600 × 513 (84 KB) | Melissa Payer (Talk | contribs) | |
| 17:46, 1 December 2014 | Error creating thumbnail: File missing | 541 × 472 (64 KB) | Melissa Payer (Talk | contribs) | Zonal difference plots showing O3 from 7-day simulations with PARANOX turned off and on. In v10-01c, we see loss of O3 in the middle/upper troposphere. The implementation of PARANOX in HEMCO (v10-01e) corrects this issue. |
- You cannot overwrite this file.
File usage
There are no pages that link to this file.