File list
This special page shows all uploaded files.
First page |
Previous page |
Next page |
Last page |
| Date | Name | Thumbnail | Size | Description | Versions |
|---|---|---|---|---|---|
| 16:21, 2 December 2016 | Obsolete.jpg (file) |  |
39 KB | Obsolete jpg | 1 |
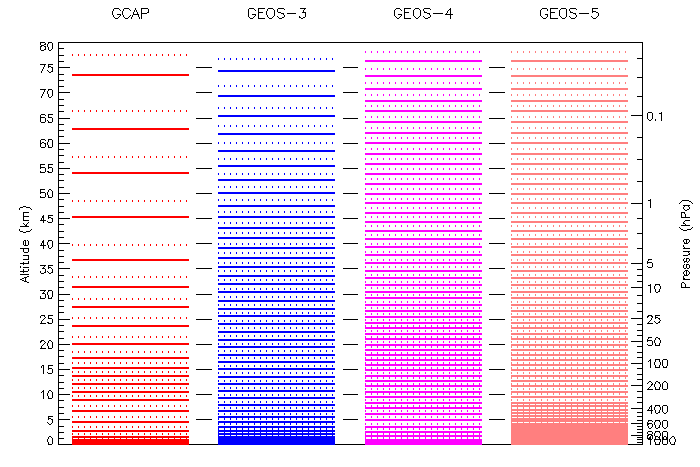
| 20:32, 14 November 2016 | Levels80km.png (file) |  |
9 KB | Comparison of vertical levels up to 80km | 1 |
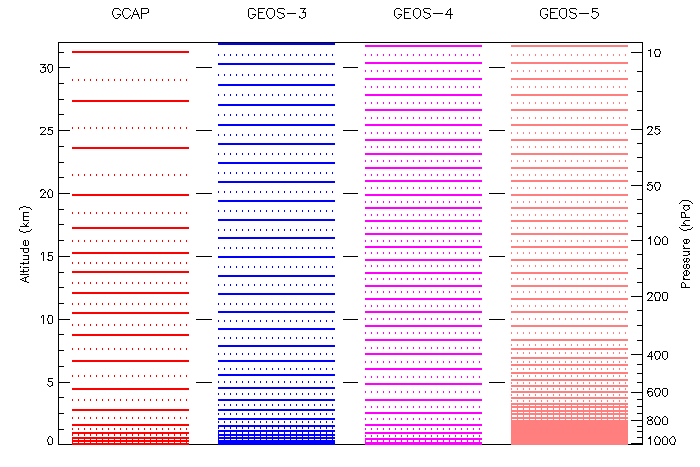
| 20:32, 14 November 2016 | Levels32km.png (file) |  |
7 KB | Comparison of vertical levels up to 32 km | 1 |
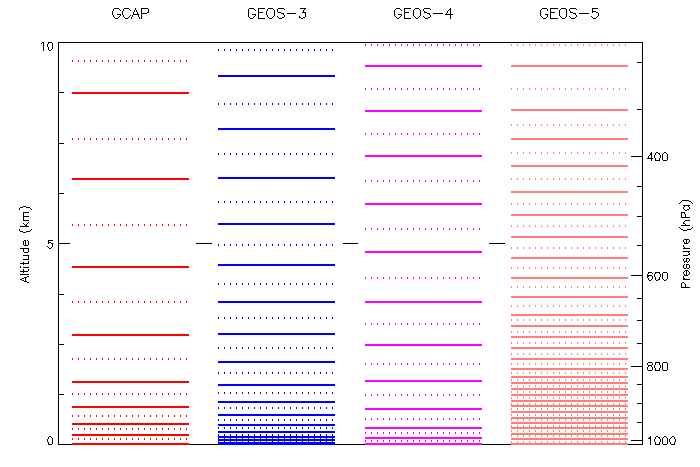
| 20:31, 14 November 2016 | Levels10km.png (file) |  |
6 KB | Comparison of vertical levels up to 10km | 1 |
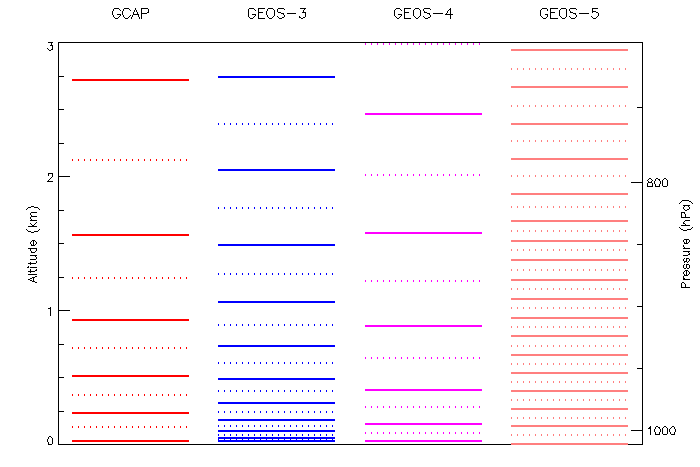
| 20:31, 14 November 2016 | Levels3km.png (file) |  |
5 KB | Comparison of vertical levels up to 3km | 1 |
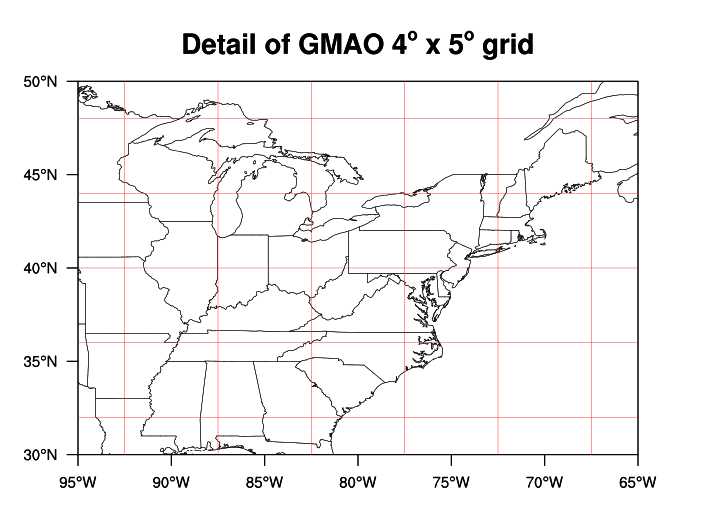
| 22:36, 10 November 2016 | Grid gmao4x5.png (file) |  |
59 KB | GMAO 4 x 5 grid | 1 |
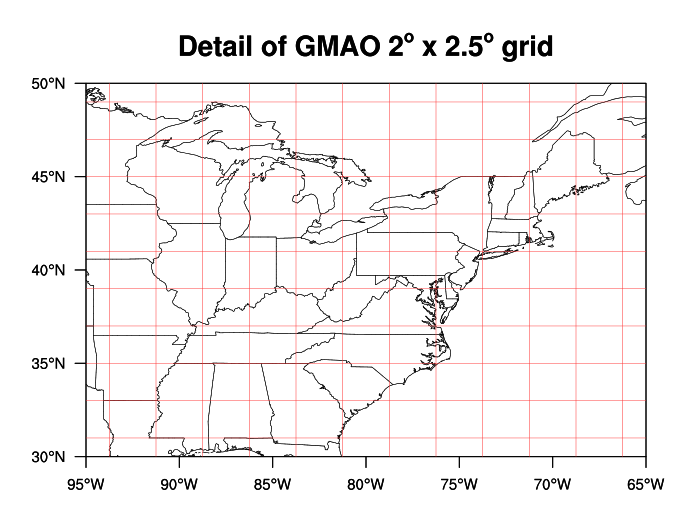
| 22:36, 10 November 2016 | Grid gmao2x25.png (file) |  |
64 KB | GMAO 2 x 2.5 grid | 1 |
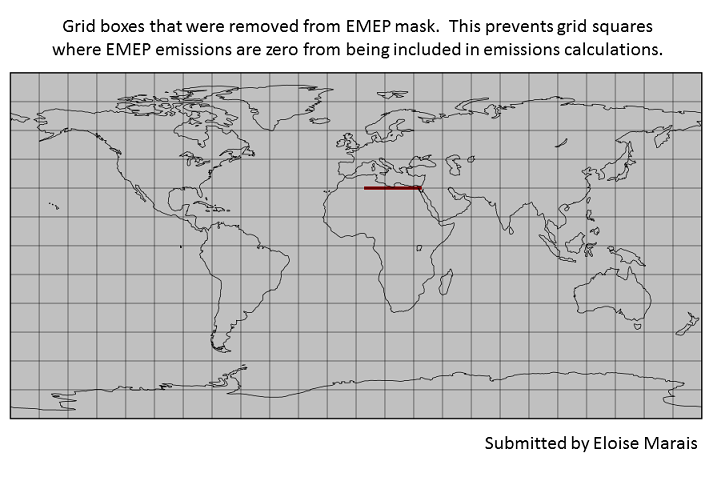
| 20:48, 6 January 2016 | Boxes removed from EMEP mask.png (file) |  |
97 KB | Shows the grid boxes removed from the EMEP mask. | 1 |
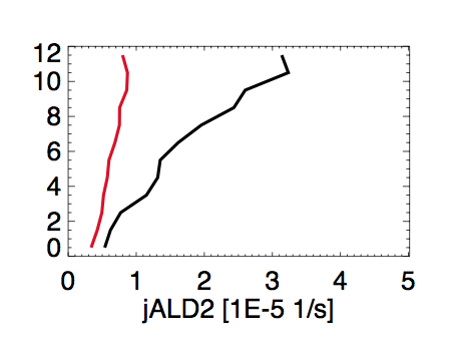
| 18:54, 27 May 2014 | ALD2 photolysis.png (file) |  |
34 KB | Plot made by Chris Chan Miller showing the discrepancy between observed and modeled J(ALD2). | 1 |
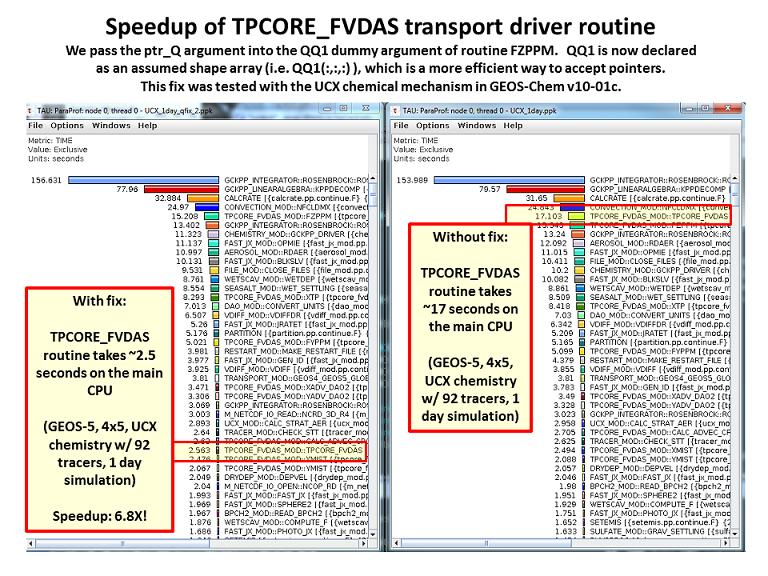
| 20:53, 16 April 2014 | TPCORE FVDAS Speedup.png (file) |  |
286 KB | Image illustrating the speedup obtained by passing ptr_Q pointer argument to an assumed-shape dummy argument qq1(:,:,:). | 1 |
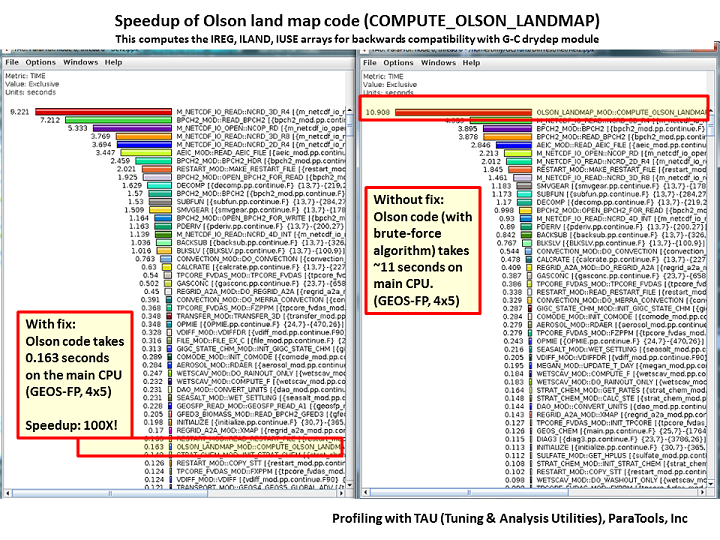
| 14:15, 21 March 2014 | Olson Speedup.png (file) |  |
287 KB | Demonstrates the speedup in the Olson landmap code. Visualization generated with the TAU profiler. | 1 |
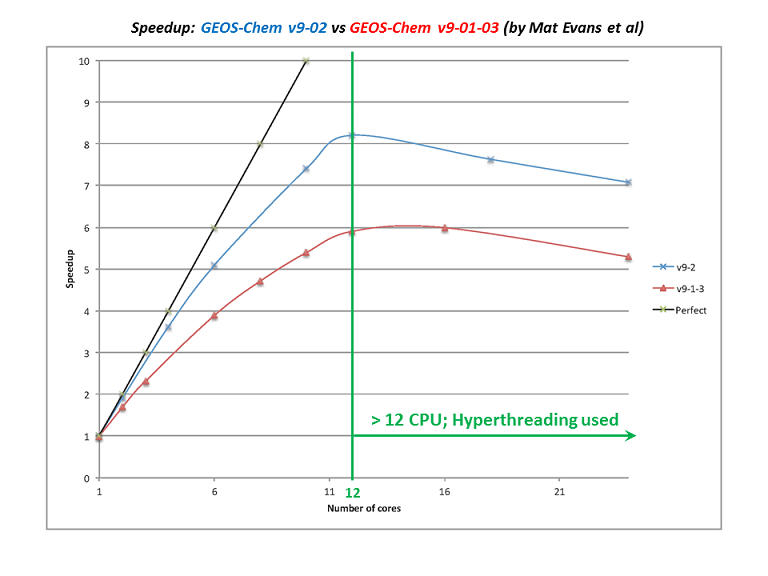
| 15:42, 19 November 2013 | Speedup v9-02.png (file) |  |
53 KB | Shows the speedup of GEOS-Chem v9-02 vs v9-01-03. | 1 |
| 16:02, 15 November 2013 | Fixed rh.jpg (file) |  |
101 KB | Contains image showing fixed units of RH in GEOS-FP, MERRA | 1 |
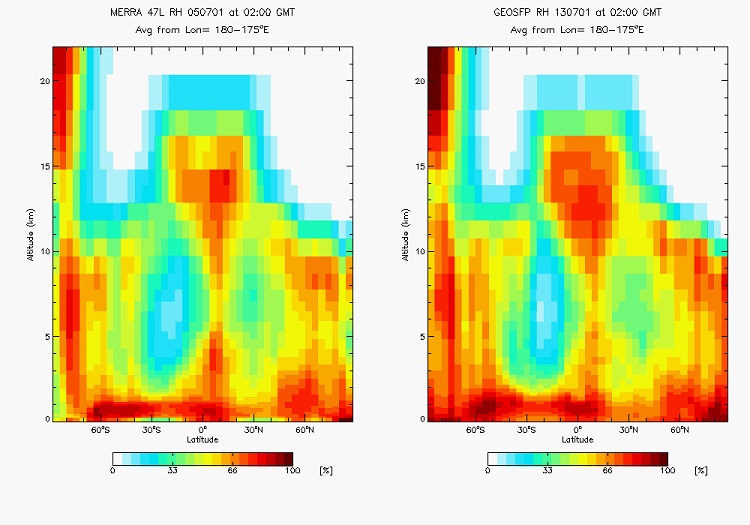
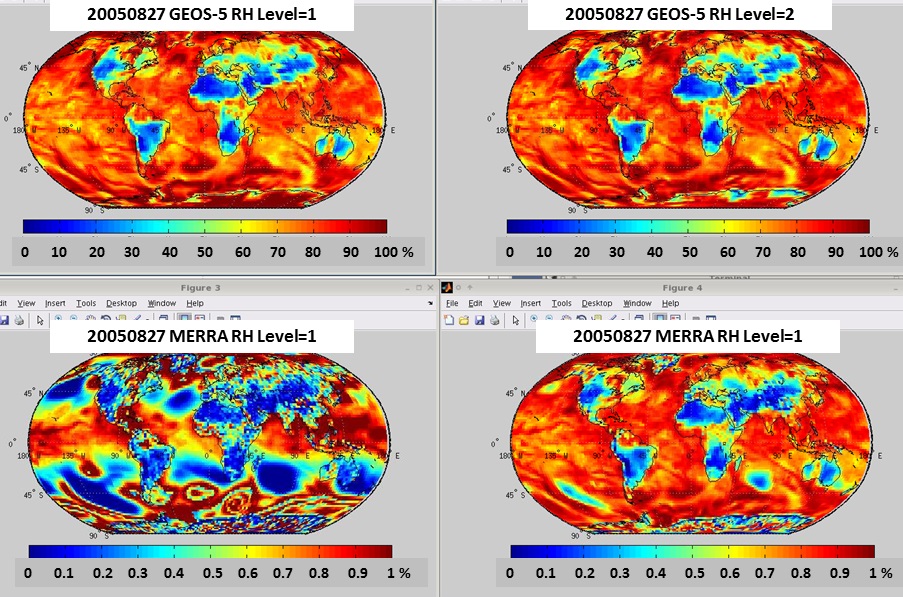
| 15:50, 15 November 2013 | MERRA RH avd.jpg (file) |  |
269 KB | Illustrates the problem of MERRA vs. GEOS-5 RH | 1 |
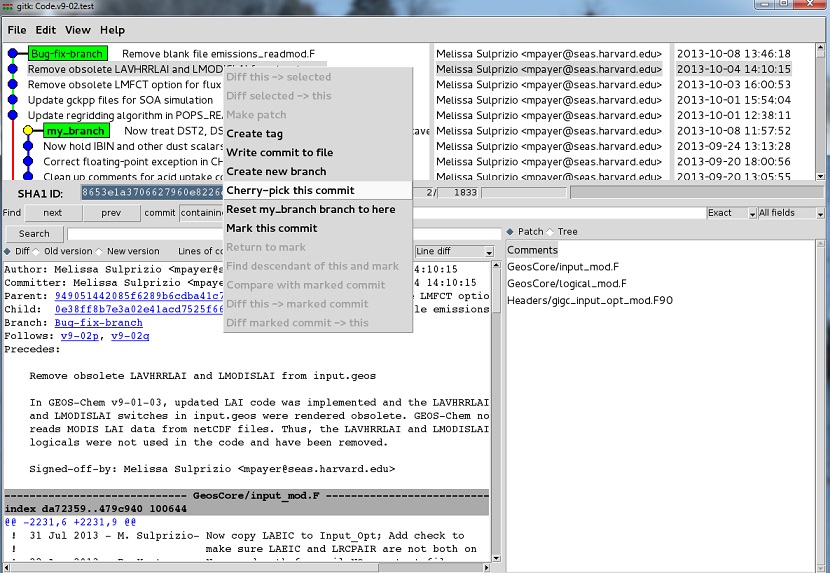
| 16:18, 11 October 2013 | Cherry pick 2.jpg (file) |  |
188 KB | Cherry-pick example #2 | 2 |
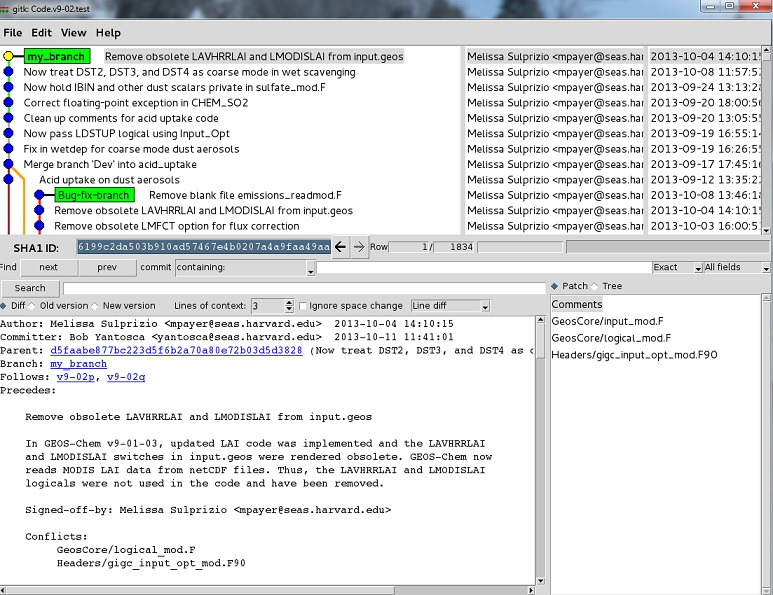
| 16:01, 11 October 2013 | Cherry pick 3.jpg (file) |  |
188 KB | Cherry pick example #3 | 1 |
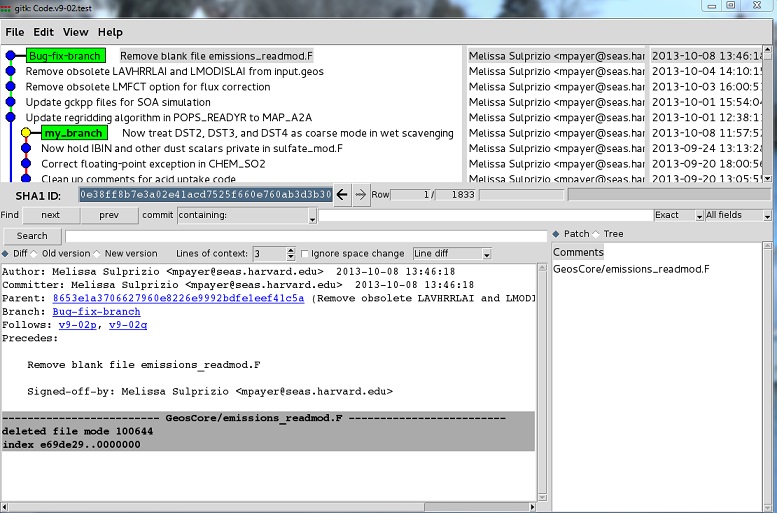
| 16:00, 11 October 2013 | Cherry pick 1.jpg (file) |  |
147 KB | Cherry pick example #1 | 1 |
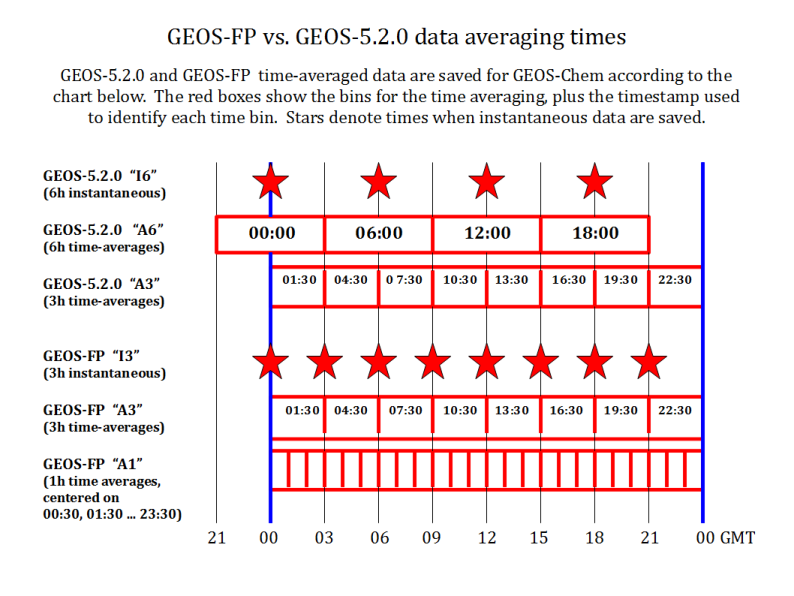
| 21:11, 16 August 2013 | GEOS FP vs GEOS 5 timing 794x596.png (file) |  |
147 KB | GEOS-FP vs. GEOS-5.2.0 met field file timestamps | 1 |
| 16:46, 10 July 2012 | V9-01-03o.compare.pdf (file) | 927 KB | Document from Lee Murray showing bromine concentration differences | 1 | |
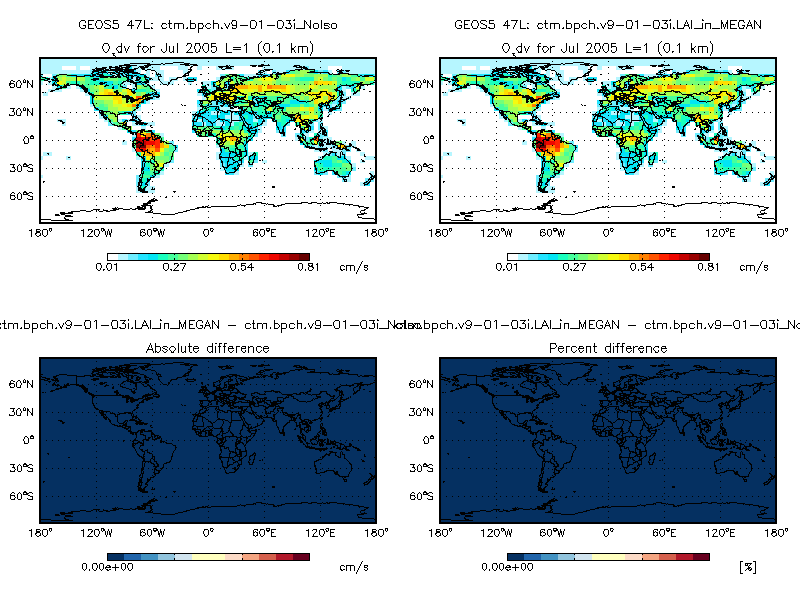
| 18:55, 13 April 2012 | Ox vd diff.png (file) |  |
29 KB | Plot of O3 dry deposition velocities, comparing GEOS-Chem v9-01-03i (using the old LAI scheme) vs. the new LAI scheme. Plots were taken from 1-month simulations. Both used the Olson 1992 land map and MODIS LAI at 0.5 x 0.5 native resolution. | 1 |
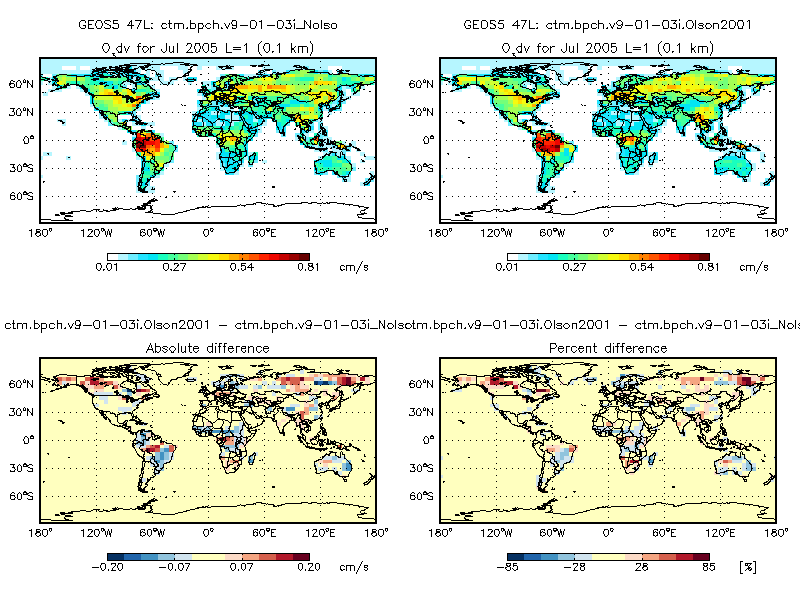
| 18:54, 13 April 2012 | Ox vd Olson2001 diff.png (file) |  |
40 KB | Difference of O3 drydep velocities generated by GEOS-Chem v9-01-03i (using Olson 1992 land map) and with the Olson 20001 land map. Note that there are signfiicant differences. | 1 |
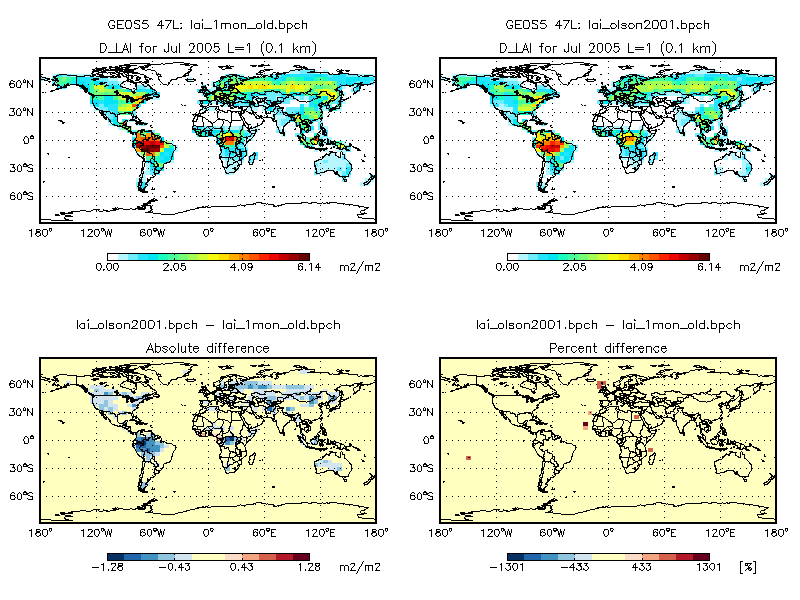
| 18:13, 13 April 2012 | Lai olson2001 diff.png (file) |  |
35 KB | Plot showing the difference of MODIS LAI (regridded from 0.25 x 0.25) to MODIS LAI regridded from 1 x 1 resolution. | 1 |
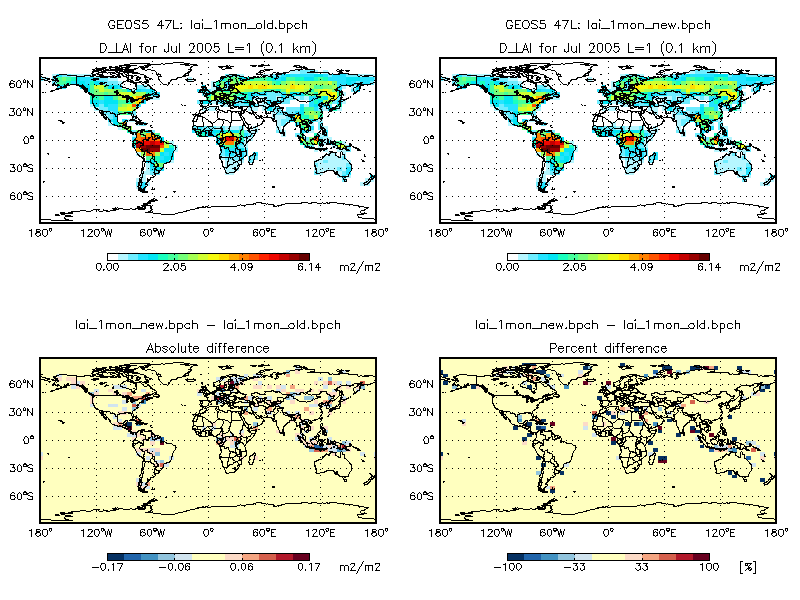
| 18:20, 12 April 2012 | Lai diff.png (file) |  |
34 KB | Shows the difference in LAI between GEOS-Chem v9-01-03i and the new LAI scheme implemented with modis_lai_mod.F90. | 1 |
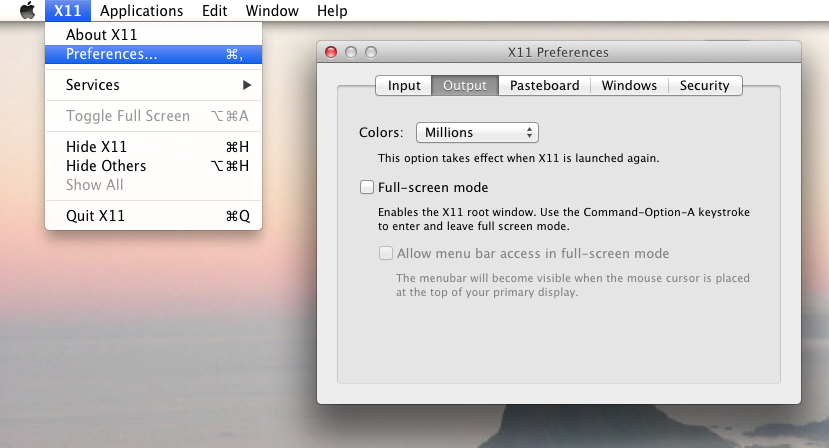
| 18:19, 12 April 2012 | Gamap xterm problem on Mac.png (file) |  |
140 KB | Screenshot of proper setting for the # of colors in an Xterm on Mac | 1 |
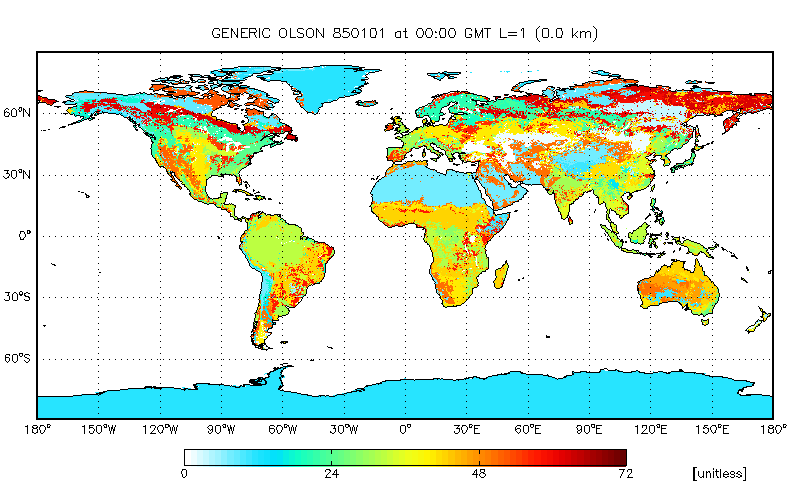
| 14:52, 23 March 2012 | Olson2001.png (file) |  |
72 KB | Olson map, 2001 | 1 |
| 16:33, 28 November 2011 | C2H6 0-8km TAO&GC 2006.pdf (file) | 55 KB | File from Dylan Jones -- Cyndi Whaley comparison w/ Kim Strong data | 1 | |
| 20:29, 23 November 2011 | Isorropia problem.pdf (file) | 64 KB | Powerpoint slides that describe the ISORROPIA II problem | 1 | |
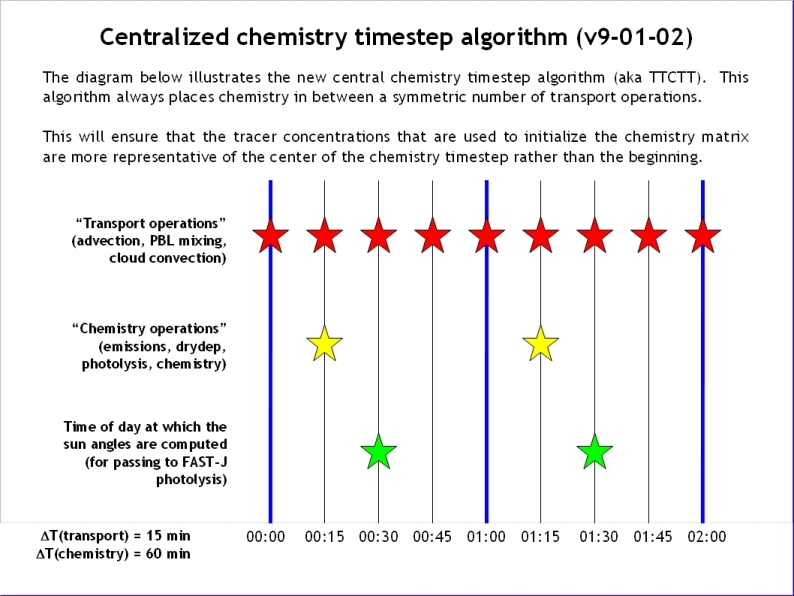
| 17:11, 20 October 2011 | Ttctt configuration.jpg (file) |  |
183 KB | v9-01-02+ chem timestepping plot | 1 |
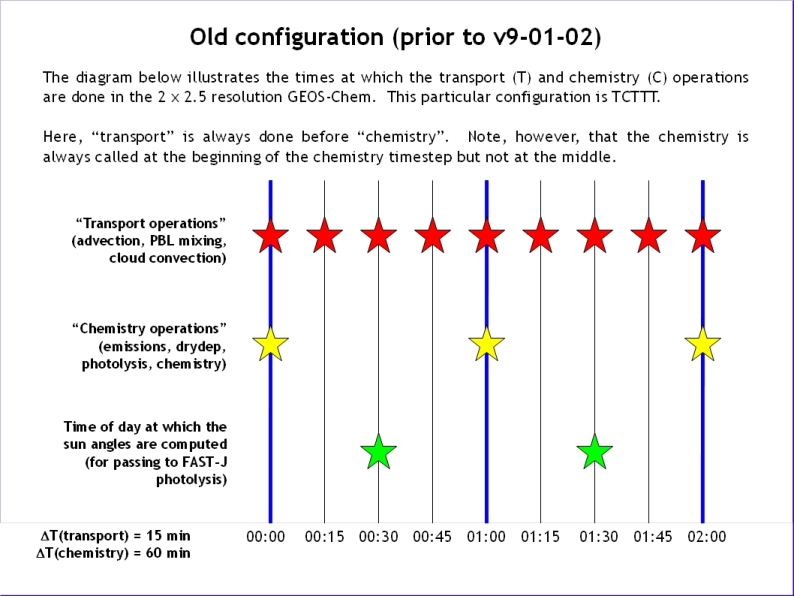
| 17:10, 20 October 2011 | Tcttt configuration.jpg (file) |  |
176 KB | pre v9-01-02 chem timestepping | 1 |
First page |
Previous page |
Next page |
Last page |