File list
This special page shows all uploaded files.
First page |
Previous page |
Next page |
Last page |
| Date | Name | Thumbnail | Size | User | Description | Versions |
|---|---|---|---|---|---|---|
| 17:19, 27 March 2015 | V10-01h ALD2 biogenic emissions.gif (file) |  |
20 KB | Melissa Payer | ALD2 biogenic emissions from the 1-month benchmark for GEOS-Chem v10-01h | 1 |
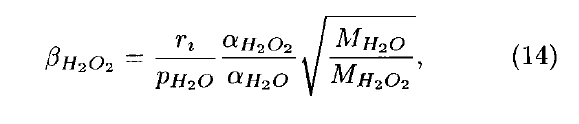
| 19:51, 19 December 2014 | GC wetdep H2O2 formulation.png (file) | 15 KB | Melissa Payer | Scavenging by co-condensation: GEOS-Chem wetdep scheme (for H2O2) for fraction in solid phase | 1 | |
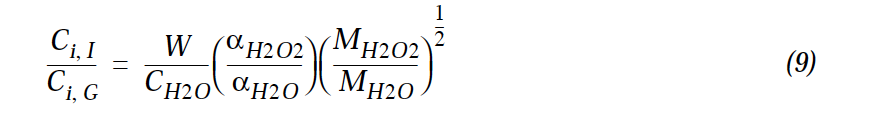
| 19:49, 19 December 2014 | Mari et al H2O2 formulation.png (file) | 7 KB | Melissa Payer | Scavenging by co-condensation: Formulation under Mari et al.(2000) (for H2O2) for fraction in solid phase | 1 | |
| 19:43, 19 December 2014 | CONV H2O2.png (file) |  |
10 KB | Melissa Payer | Definition of CONV_H2O2 from Mari et al. (2000) | 1 |
| 17:53, 19 June 2014 | Seac4rs jval PratherXSect.png (file) |  |
63 KB | Emarais | 2 | |
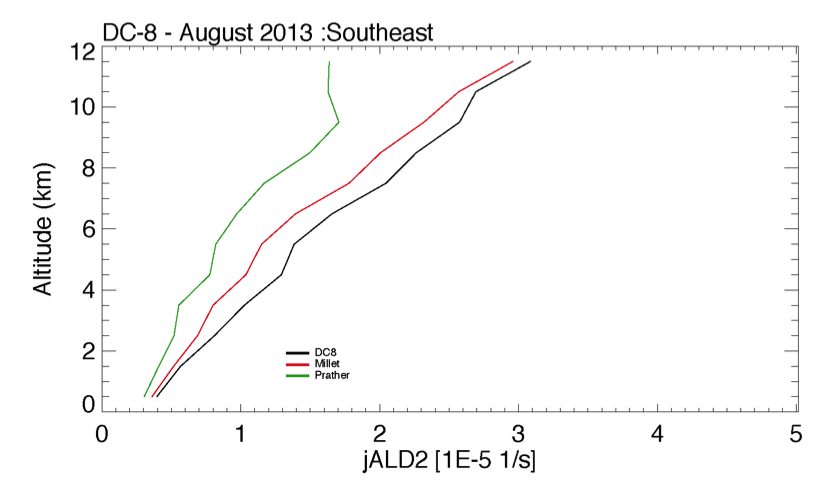
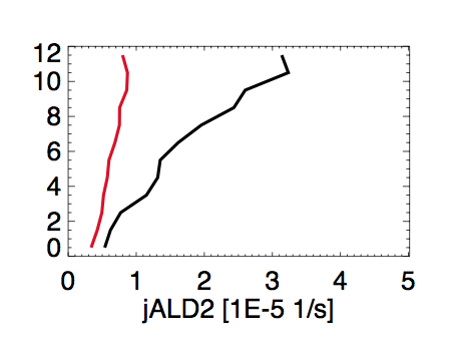
| 18:54, 27 May 2014 | ALD2 photolysis.png (file) |  |
34 KB | Bmy | Plot made by Chris Chan Miller showing the discrepancy between observed and modeled J(ALD2). | 1 |
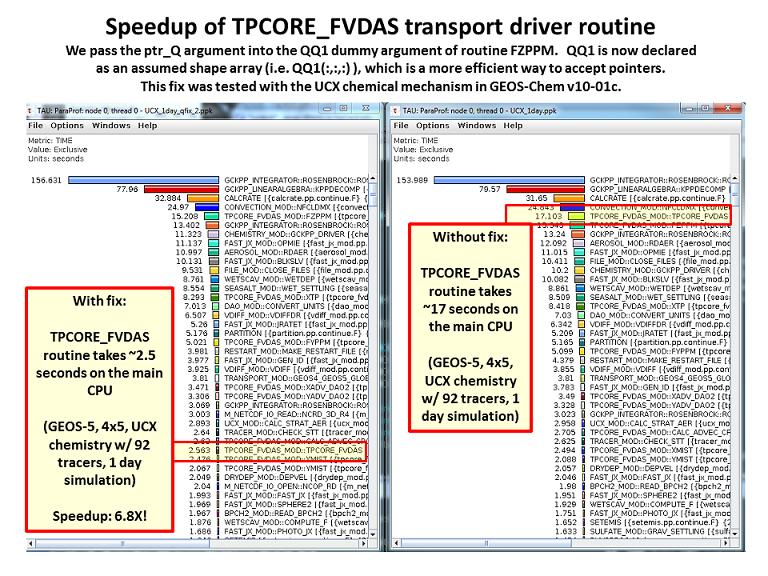
| 20:53, 16 April 2014 | TPCORE FVDAS Speedup.png (file) |  |
286 KB | Bmy | Image illustrating the speedup obtained by passing ptr_Q pointer argument to an assumed-shape dummy argument qq1(:,:,:). | 1 |
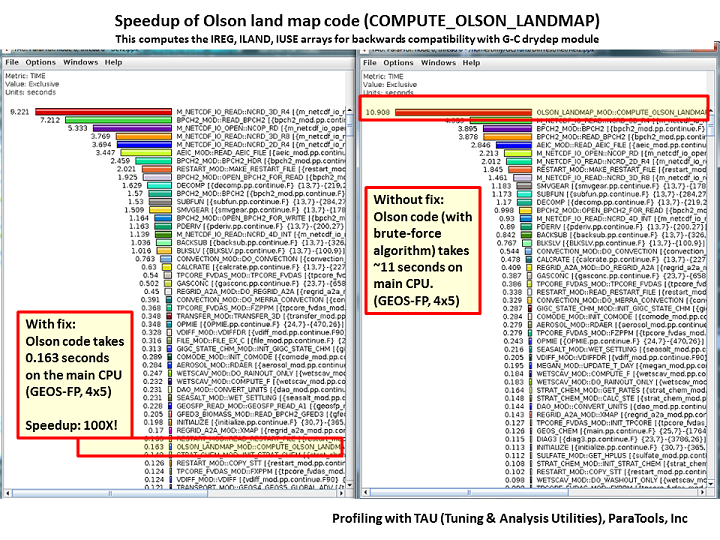
| 14:15, 21 March 2014 | Olson Speedup.png (file) |  |
287 KB | Bmy | Demonstrates the speedup in the Olson landmap code. Visualization generated with the TAU profiler. | 1 |
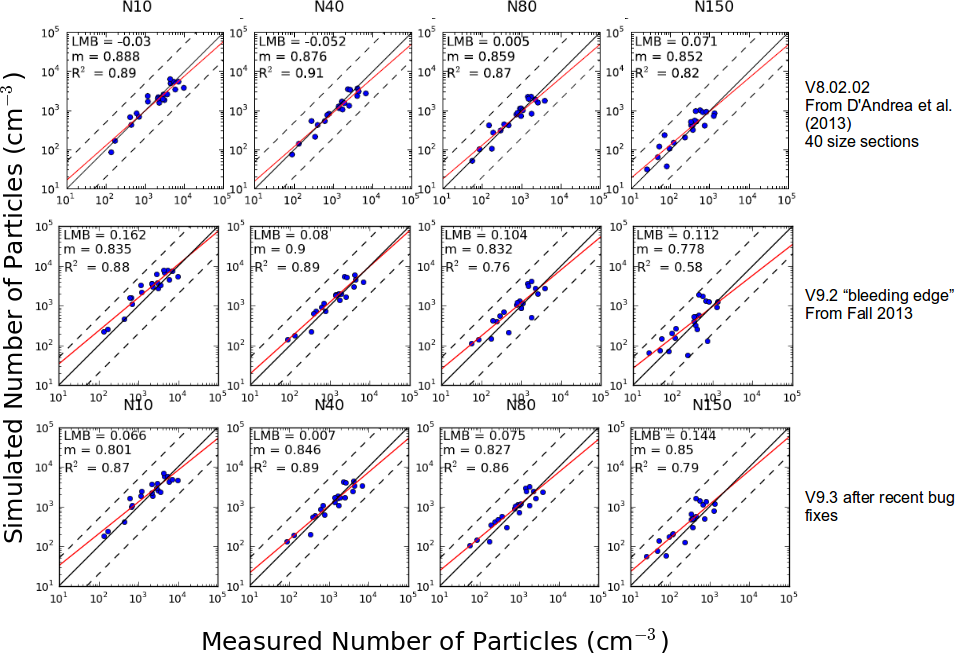
| 20:23, 4 March 2014 | GEOS-Chem-TOMAS performance update 20140304.png (file) |  |
251 KB | Jeff Pierce | 1 | |
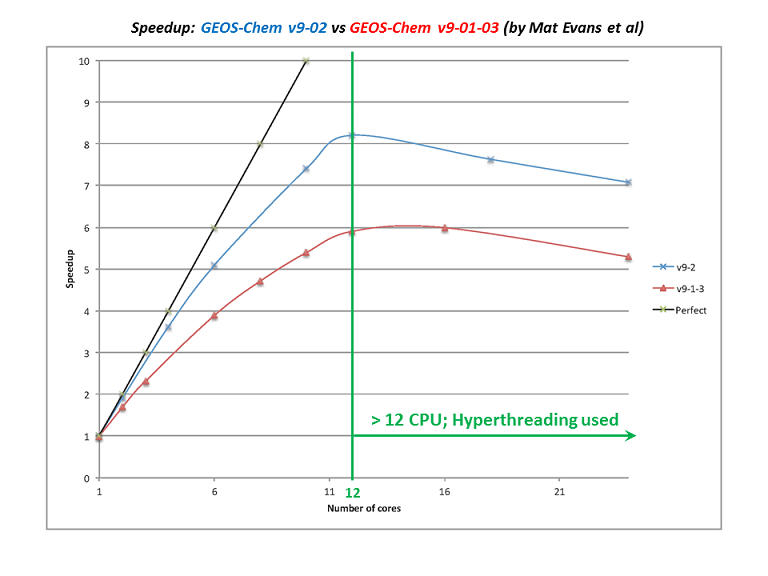
| 15:42, 19 November 2013 | Speedup v9-02.png (file) |  |
53 KB | Bmy | Shows the speedup of GEOS-Chem v9-02 vs v9-01-03. | 1 |
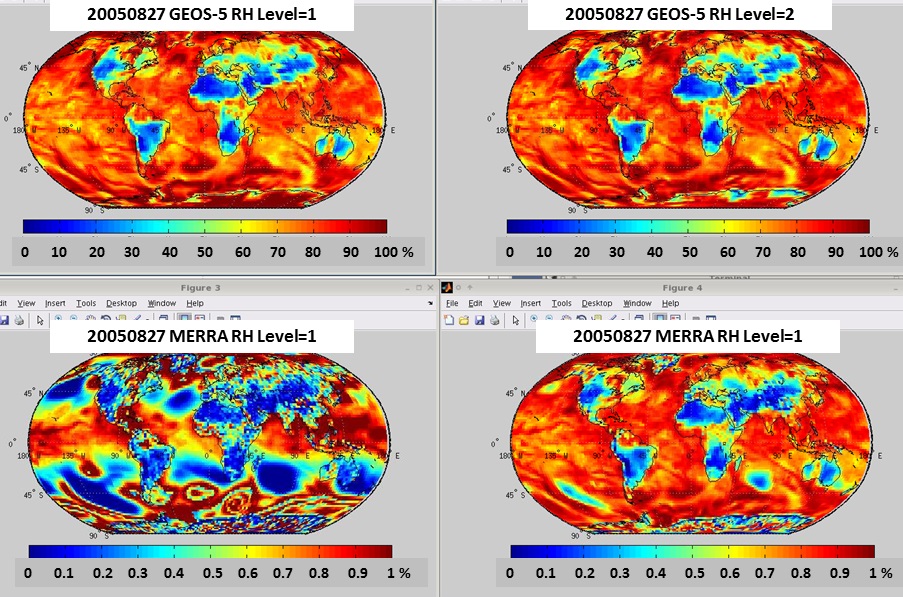
| 16:02, 15 November 2013 | Fixed rh.jpg (file) |  |
101 KB | Bmy | Contains image showing fixed units of RH in GEOS-FP, MERRA | 1 |
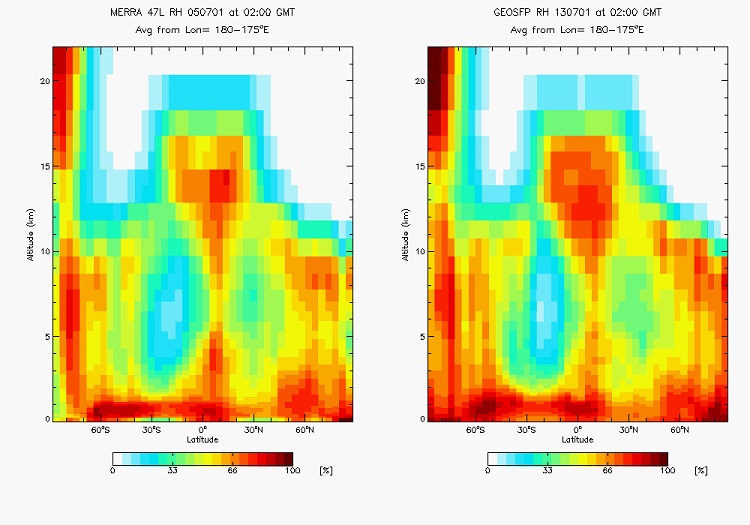
| 15:50, 15 November 2013 | MERRA RH avd.jpg (file) |  |
269 KB | Bmy | Illustrates the problem of MERRA vs. GEOS-5 RH | 1 |
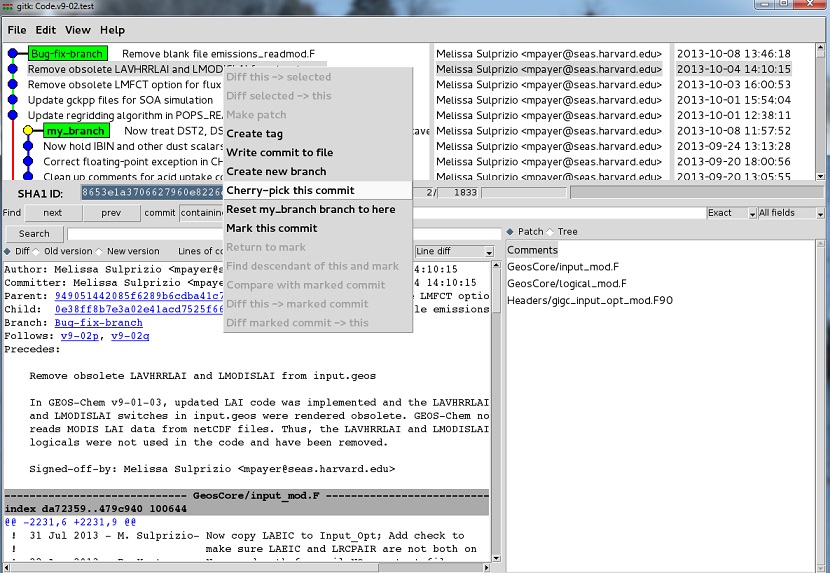
| 16:18, 11 October 2013 | Cherry pick 2.jpg (file) |  |
188 KB | Bmy | Cherry-pick example #2 | 2 |
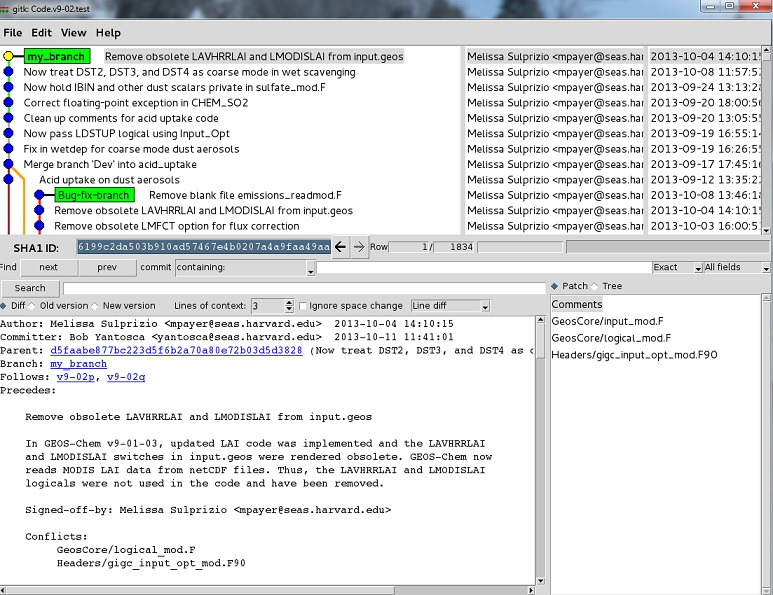
| 16:01, 11 October 2013 | Cherry pick 3.jpg (file) |  |
188 KB | Bmy | Cherry pick example #3 | 1 |
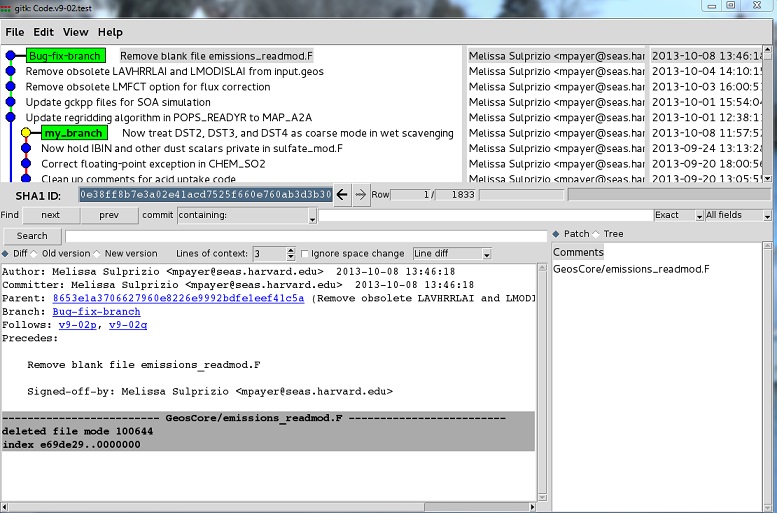
| 16:00, 11 October 2013 | Cherry pick 1.jpg (file) |  |
147 KB | Bmy | Cherry pick example #1 | 1 |
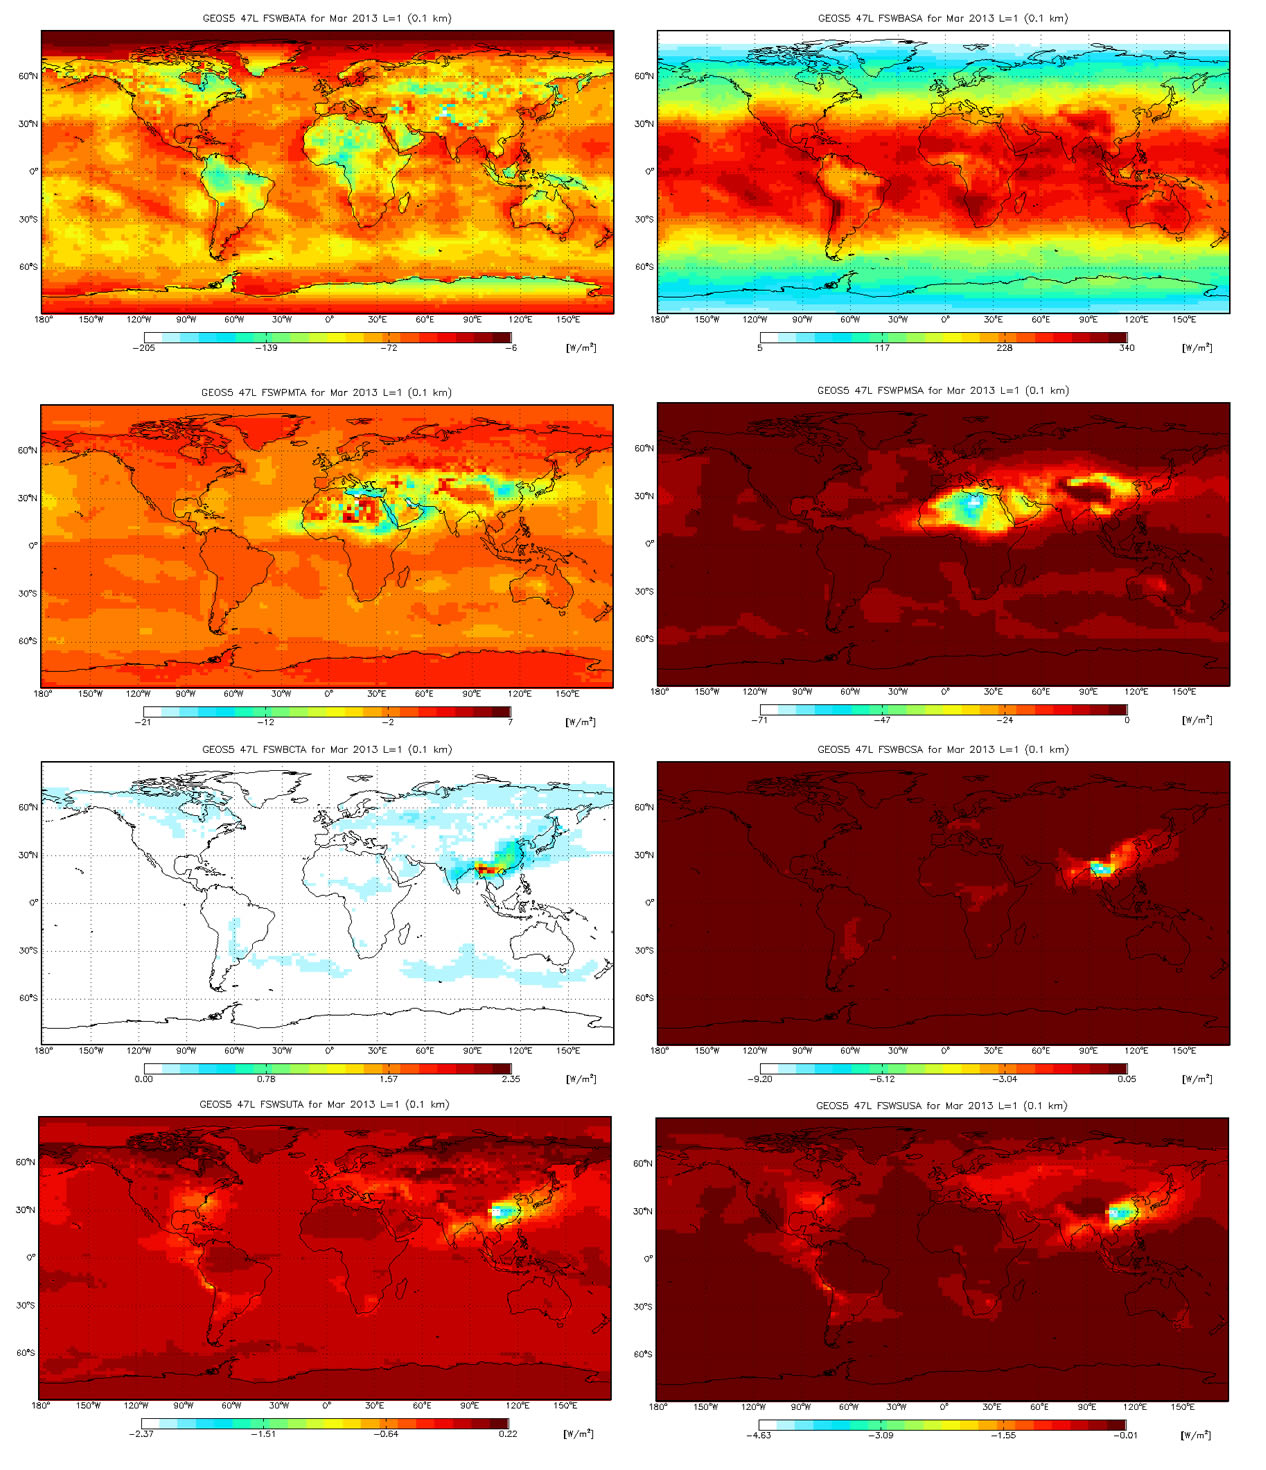
| 16:15, 9 October 2013 | Example DRE figures.jpg (file) |  |
402 KB | David Ridley | Example output fluxes and direct radiative effect (DRE) from GCRT for March 2013. The top row show the total flux with all aerosol and gases included, subsequent rows show the DRE for all particulate matter, black carbon, and sulfate. The left column show | 2 |
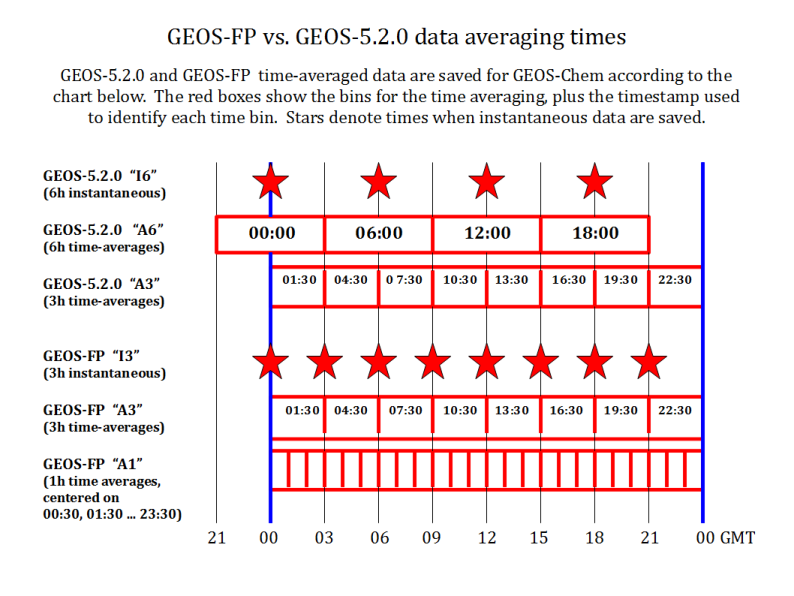
| 21:11, 16 August 2013 | GEOS FP vs GEOS 5 timing 794x596.png (file) |  |
147 KB | Bmy | GEOS-FP vs. GEOS-5.2.0 met field file timestamps | 1 |
| 00:09, 12 July 2012 | V9-01-03o.benchmark.vs.GMI.pdf (file) | 1.26 MB | Ltmurray | Comparison of v9-01-03n, v9-01-03o 1 month benchmarks zonal mean concentrations, and the climatological concentrations from the GMI Combo model from which the v9-01-03o prod/loss rates were derived. | 1 | |
| 16:46, 10 July 2012 | V9-01-03o.compare.pdf (file) | 927 KB | Bmy | Document from Lee Murray showing bromine concentration differences | 1 | |
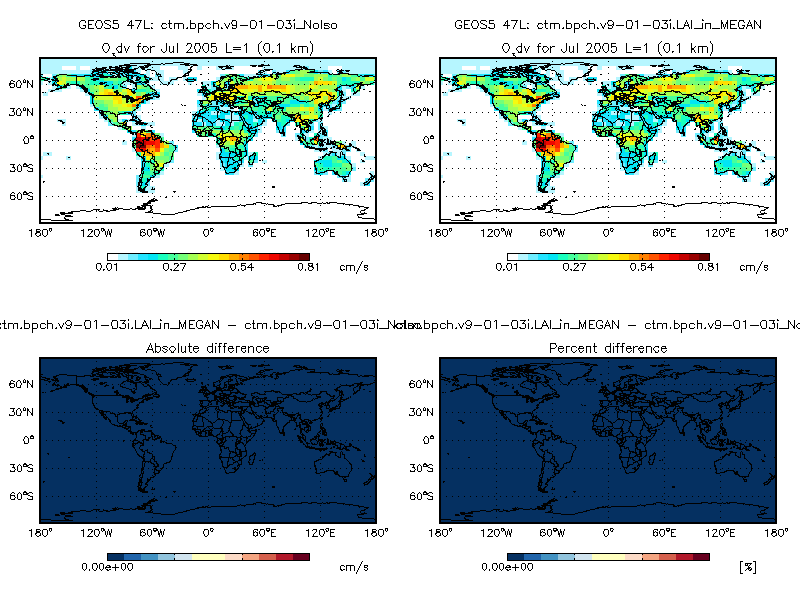
| 18:55, 13 April 2012 | Ox vd diff.png (file) |  |
29 KB | Bmy | Plot of O3 dry deposition velocities, comparing GEOS-Chem v9-01-03i (using the old LAI scheme) vs. the new LAI scheme. Plots were taken from 1-month simulations. Both used the Olson 1992 land map and MODIS LAI at 0.5 x 0.5 native resolution. | 1 |
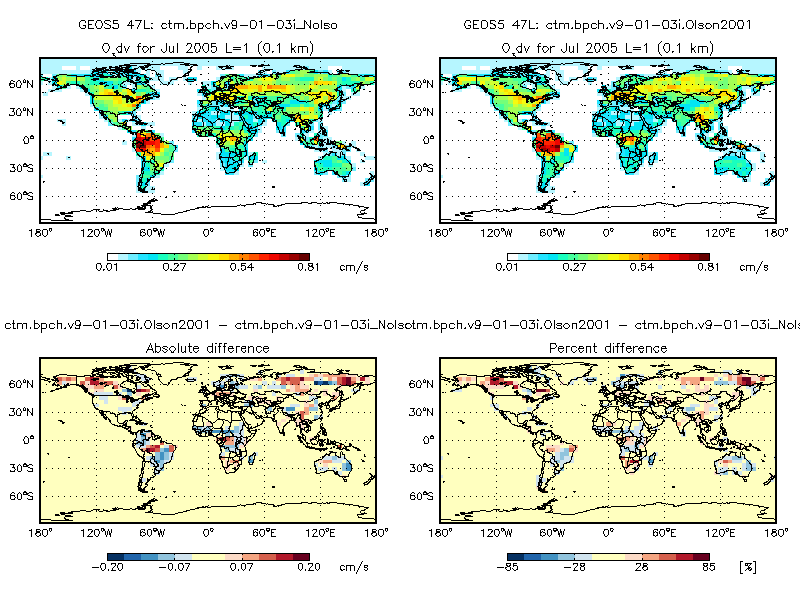
| 18:54, 13 April 2012 | Ox vd Olson2001 diff.png (file) |  |
40 KB | Bmy | Difference of O3 drydep velocities generated by GEOS-Chem v9-01-03i (using Olson 1992 land map) and with the Olson 20001 land map. Note that there are signfiicant differences. | 1 |
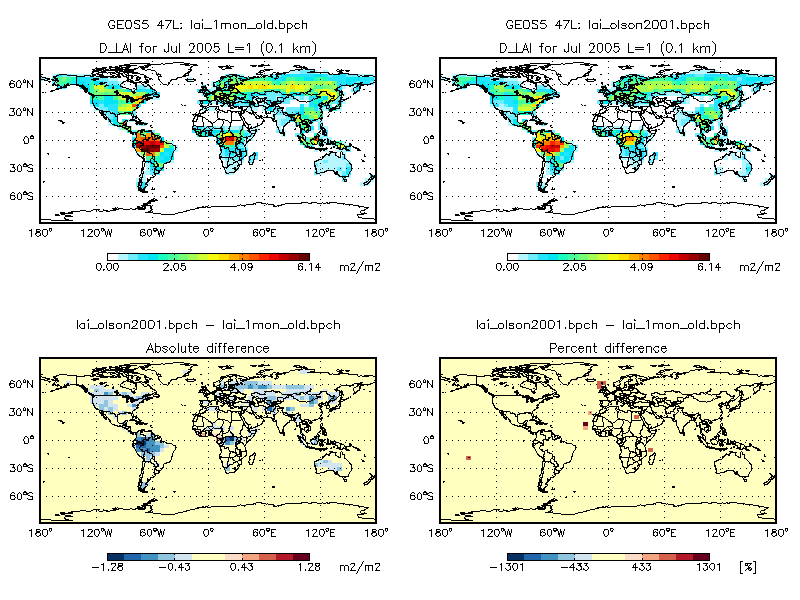
| 18:13, 13 April 2012 | Lai olson2001 diff.png (file) |  |
35 KB | Bmy | Plot showing the difference of MODIS LAI (regridded from 0.25 x 0.25) to MODIS LAI regridded from 1 x 1 resolution. | 1 |
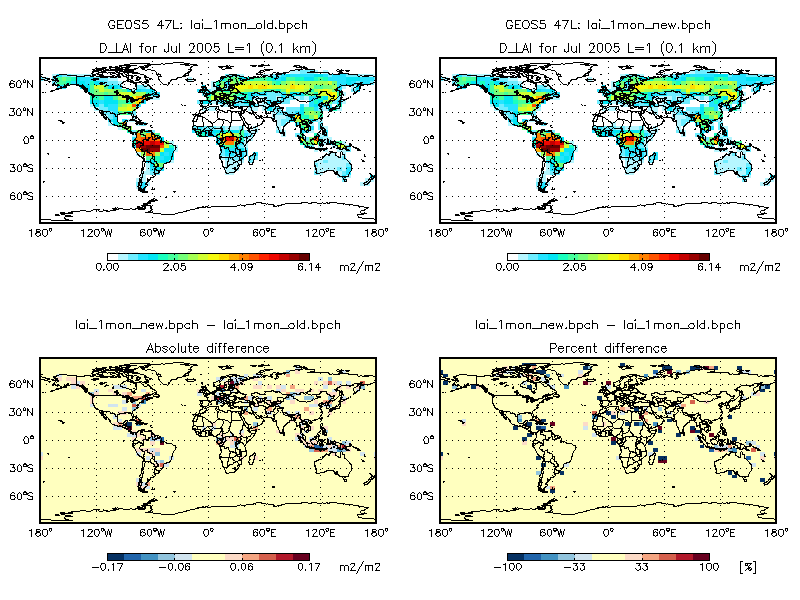
| 18:20, 12 April 2012 | Lai diff.png (file) |  |
34 KB | Bmy | Shows the difference in LAI between GEOS-Chem v9-01-03i and the new LAI scheme implemented with modis_lai_mod.F90. | 1 |
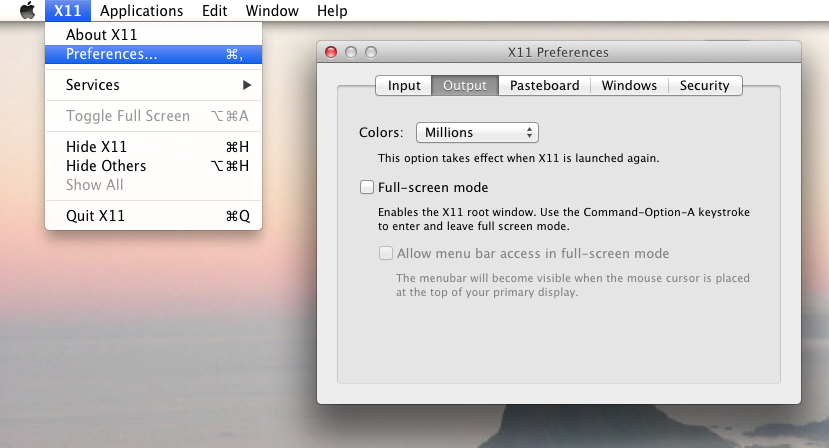
| 18:19, 12 April 2012 | Gamap xterm problem on Mac.png (file) |  |
140 KB | Bmy | Screenshot of proper setting for the # of colors in an Xterm on Mac | 1 |
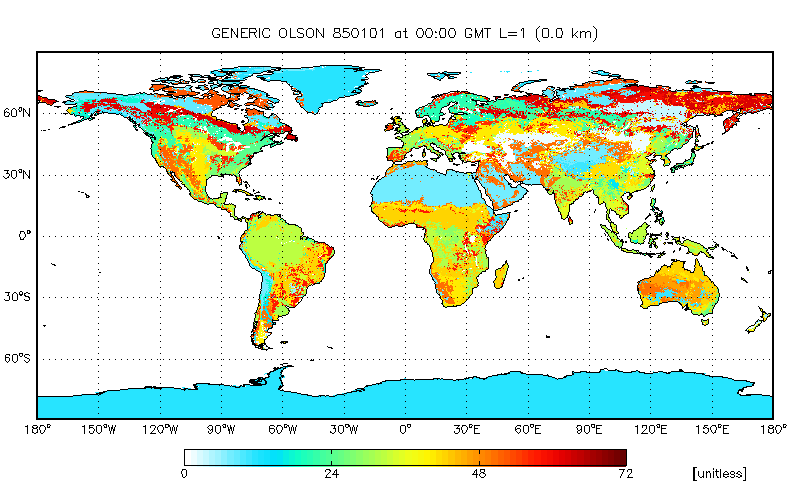
| 14:52, 23 March 2012 | Olson2001.png (file) |  |
72 KB | Bmy | Olson map, 2001 | 1 |
| 16:33, 28 November 2011 | C2H6 0-8km TAO&GC 2006.pdf (file) | 55 KB | Bmy | File from Dylan Jones -- Cyndi Whaley comparison w/ Kim Strong data | 1 | |
| 20:29, 23 November 2011 | Isorropia problem.pdf (file) | 64 KB | Bmy | Powerpoint slides that describe the ISORROPIA II problem | 1 | |
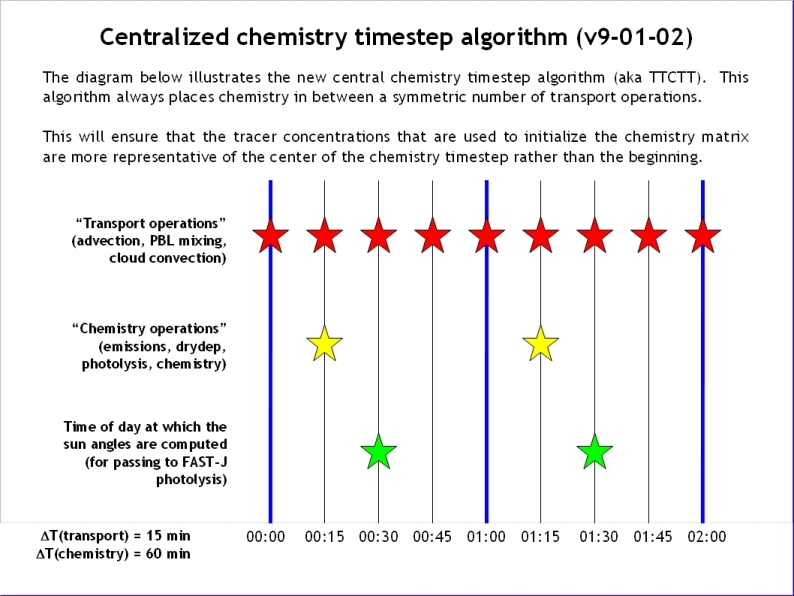
| 17:11, 20 October 2011 | Ttctt configuration.jpg (file) |  |
183 KB | Bmy | v9-01-02+ chem timestepping plot | 1 |
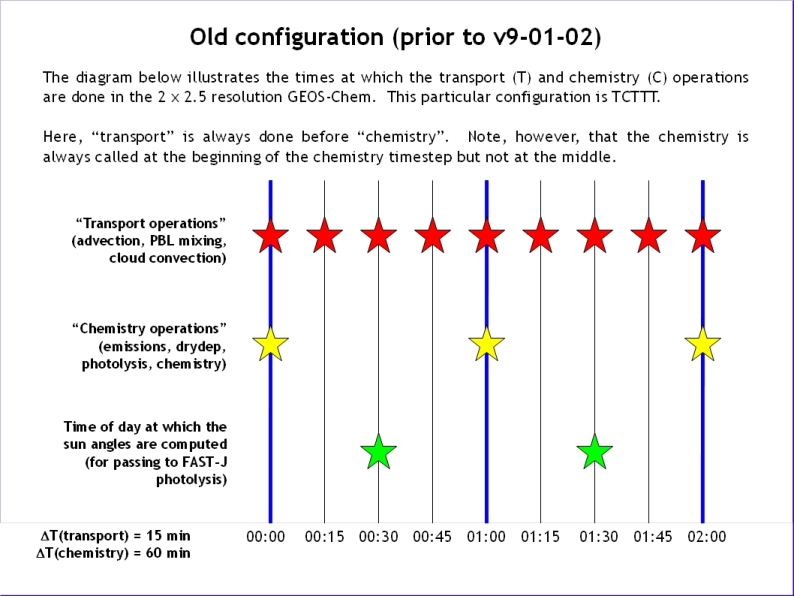
| 17:10, 20 October 2011 | Tcttt configuration.jpg (file) |  |
176 KB | Bmy | pre v9-01-02 chem timestepping | 1 |
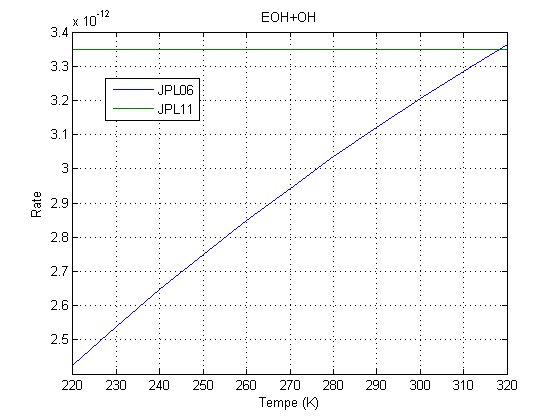
| 16:29, 18 July 2011 | EOH OH.png (file) |  |
8 KB | Jmao | 1 | |
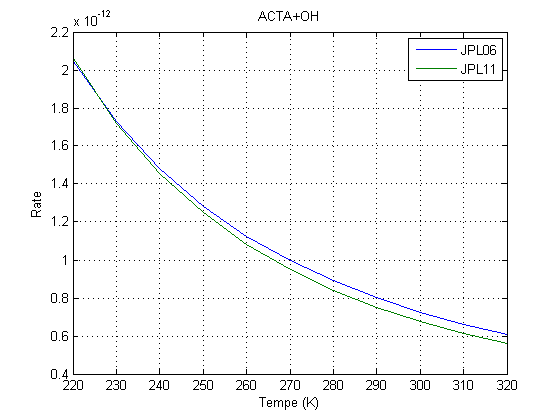
| 16:28, 18 July 2011 | ACTA OH.png (file) |  |
8 KB | Jmao | 1 | |
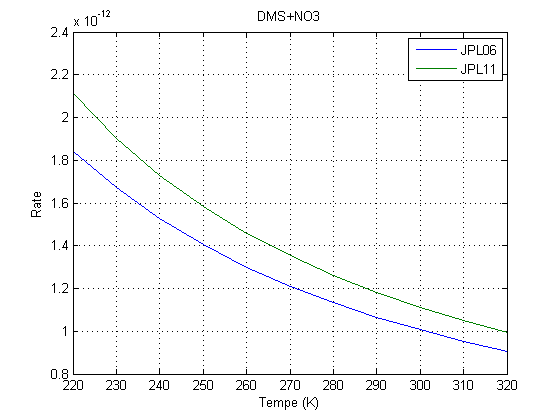
| 21:37, 14 July 2011 | DMS NO3.png (file) |  |
8 KB | Jmao | 1 | |
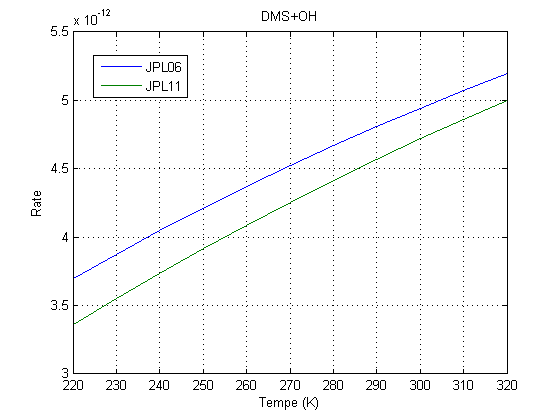
| 21:37, 14 July 2011 | DMS OH.png (file) |  |
8 KB | Jmao | 1 | |
| 21:37, 14 July 2011 | DMS OH O2.png (file) |  |
8 KB | Jmao | 1 | |
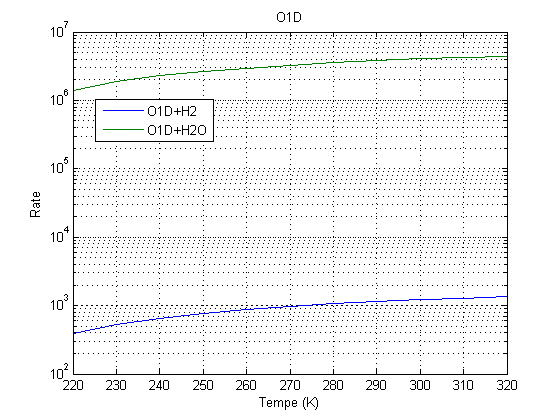
| 20:16, 14 July 2011 | O1D H2.png (file) |  |
8 KB | Jmao | 1 | |
| 02:03, 14 July 2011 | HO2 HO2.png (file) |  |
8 KB | Jmao | 1 | |
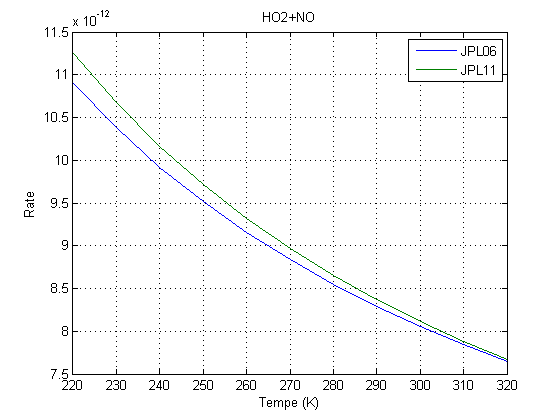
| 01:41, 14 July 2011 | HO2 NO.png (file) |  |
8 KB | Jmao | 1 | |
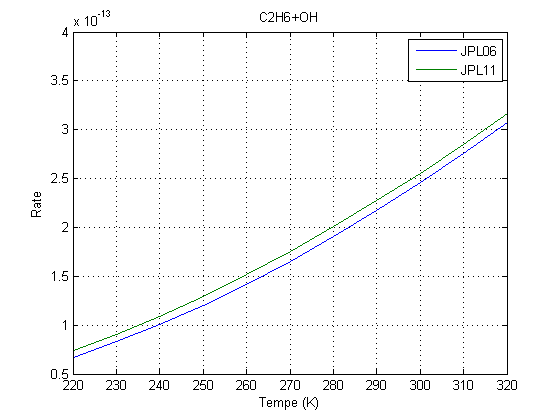
| 01:20, 14 July 2011 | C2H6 OH.png (file) |  |
8 KB | Jmao | 1 | |
| 01:20, 14 July 2011 | ALD2 OH.png (file) |  |
8 KB | Jmao | 1 | |
| 01:07, 14 July 2011 | ISOP O3.png (file) |  |
8 KB | Jmao | 1 | |
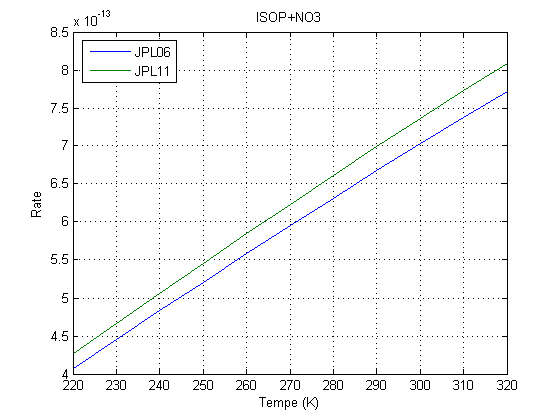
| 01:06, 14 July 2011 | ISOP NO3.png (file) |  |
8 KB | Jmao | 1 | |
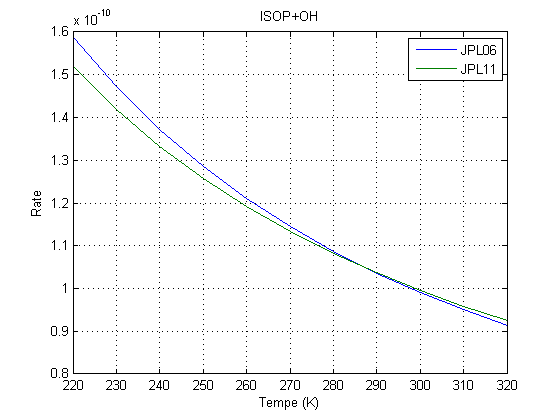
| 22:17, 13 July 2011 | ISOP OH.png (file) |  |
8 KB | Jmao | 1 | |
| 22:27, 24 May 2011 | GC seasalt update.pdf (file) | 924 KB | Jaegle | 1 | ||
| 17:18, 24 May 2011 | SST gong.png (file) | 17 KB | Jaegle | 1 | ||
| 17:12, 24 May 2011 | Gong.png (file) | 11 KB | Jaegle | 1 |
First page |
Previous page |
Next page |
Last page |