File list
This special page shows all uploaded files.
First page |
Previous page |
Next page |
Last page |
| Date | Name | Thumbnail | Size | User | Description | Versions |
|---|---|---|---|---|---|---|
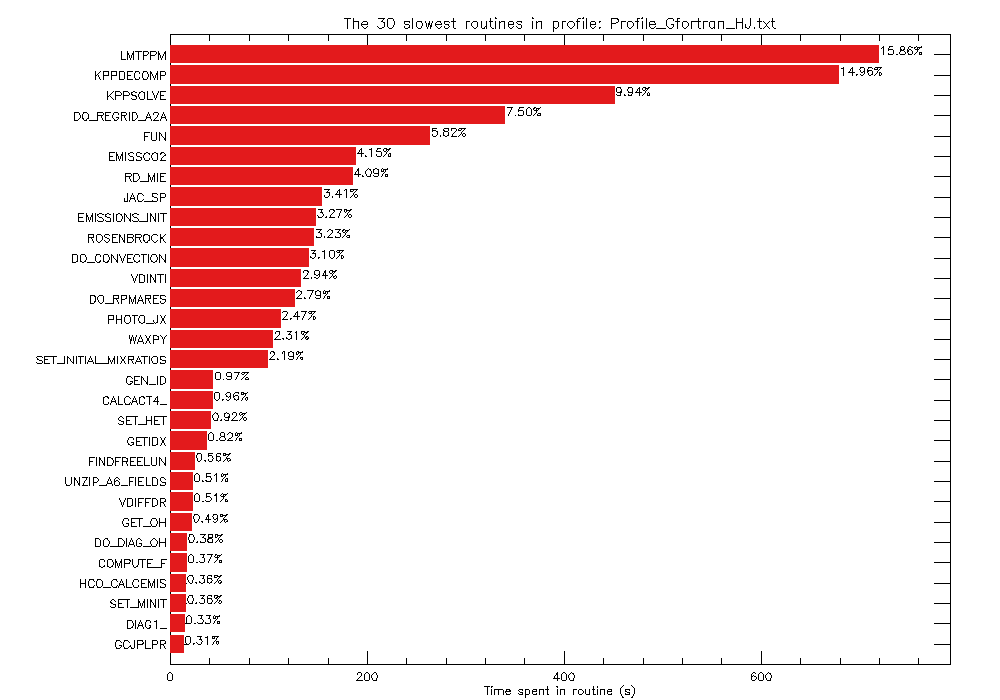
| 20:18, 15 December 2016 | Plot gprof output.png (file) |  |
14 KB | Bmy | Example plot from the GAMAP "plot_gprof.pro" routine. | 1 |
| 23:12, 6 December 2016 | MERRA2 05x0625 NA.png (file) |  |
8 KB | Melissa Payer | MERRA-2 0.5 x 0.625 nested NA grid | 1 |
| 23:12, 6 December 2016 | MERRA2 05x0625 EU.png (file) |  |
9 KB | Melissa Payer | MERRA-2 0.5 x 0.625 nested EU grid | 1 |
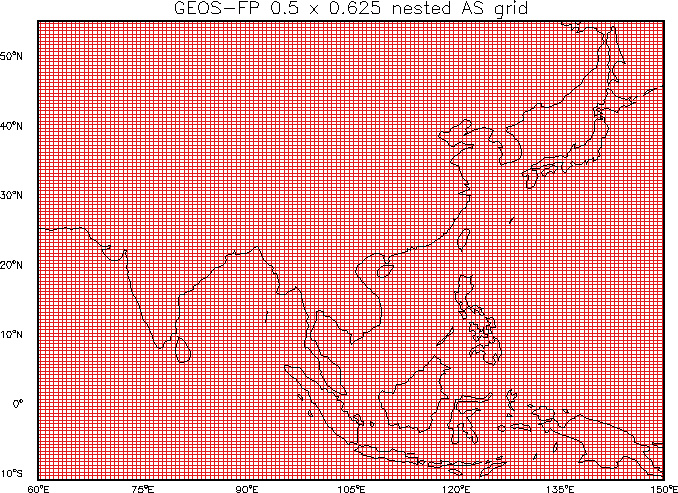
| 23:11, 6 December 2016 | MERRA2 05x0625 AS.png (file) |  |
7 KB | Melissa Payer | MERRA-2 0.5 x 0.625 nested AS grid | 1 |
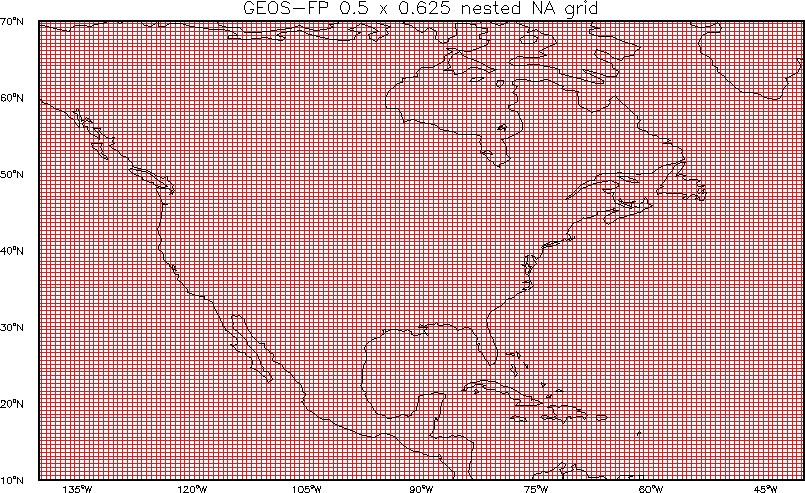
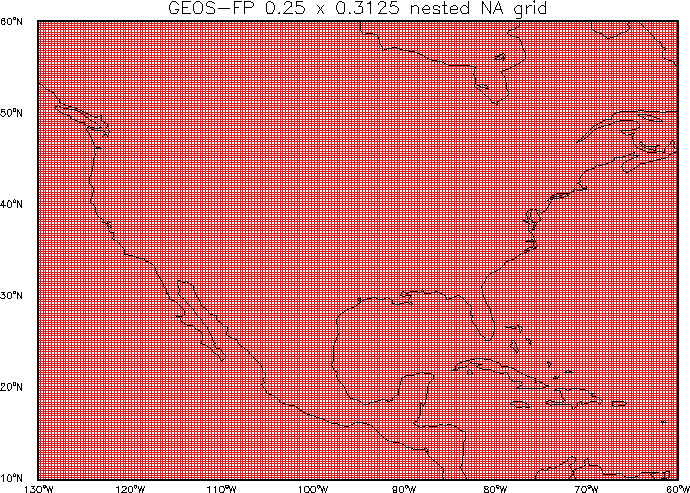
| 23:11, 6 December 2016 | GEOSFP 025x03125 NA.png (file) |  |
7 KB | Melissa Payer | GEOS-FP 0.25 x 0.3125 nested NA grid | 1 |
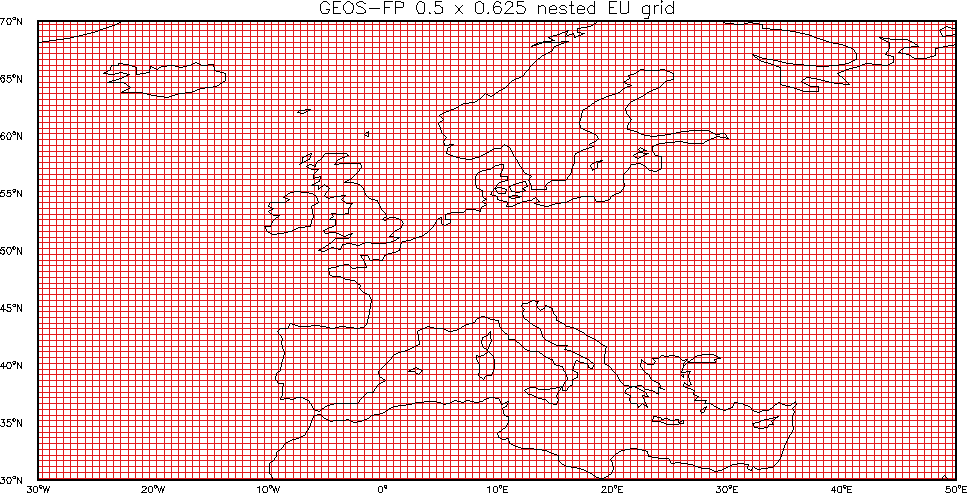
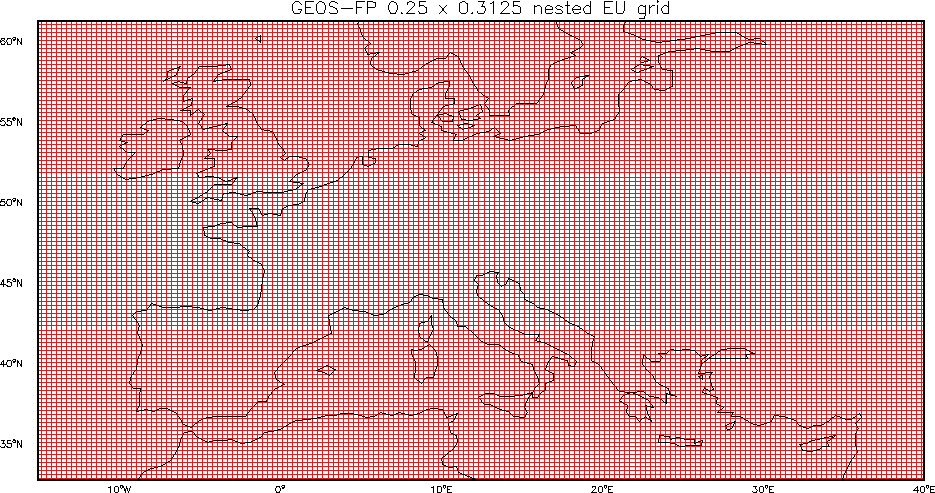
| 23:10, 6 December 2016 | GEOSFP 025x03125 EU.png (file) |  |
9 KB | Melissa Payer | GEOS-FP 0.25 x 0.3125 nested EU grid | 1 |
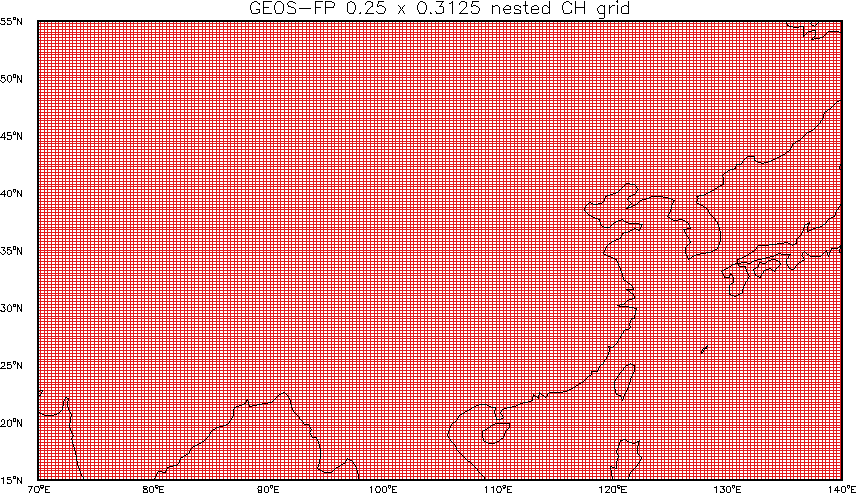
| 23:10, 6 December 2016 | GEOSFP 025x03125 CH.png (file) |  |
6 KB | Melissa Payer | GEOS-FP 0.25 x 0.3125 nested CH grid | 1 |
| 16:21, 2 December 2016 | Obsolete.jpg (file) |  |
39 KB | Bmy | Obsolete jpg | 1 |
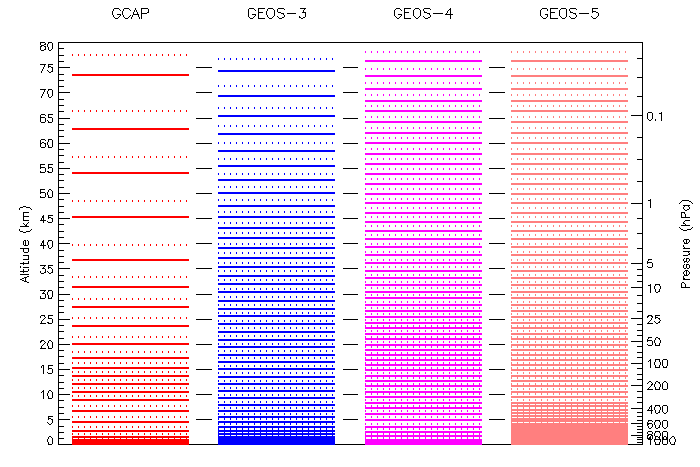
| 20:32, 14 November 2016 | Levels80km.png (file) |  |
9 KB | Bmy | Comparison of vertical levels up to 80km | 1 |
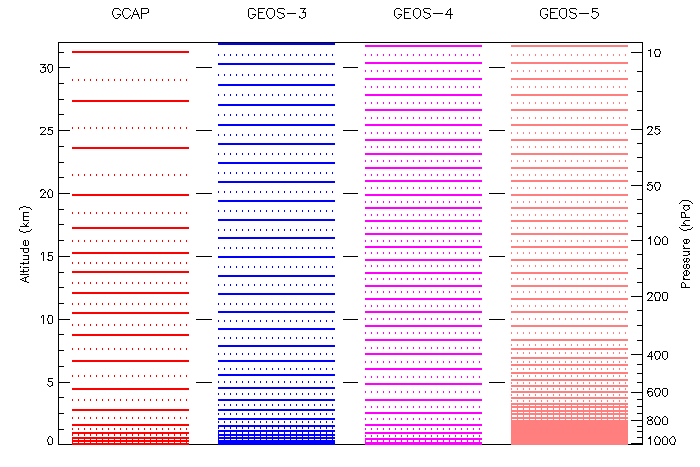
| 20:32, 14 November 2016 | Levels32km.png (file) |  |
7 KB | Bmy | Comparison of vertical levels up to 32 km | 1 |
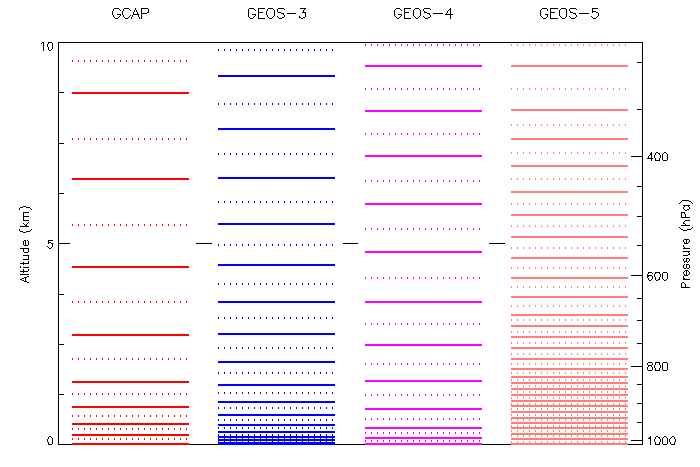
| 20:31, 14 November 2016 | Levels10km.png (file) |  |
6 KB | Bmy | Comparison of vertical levels up to 10km | 1 |
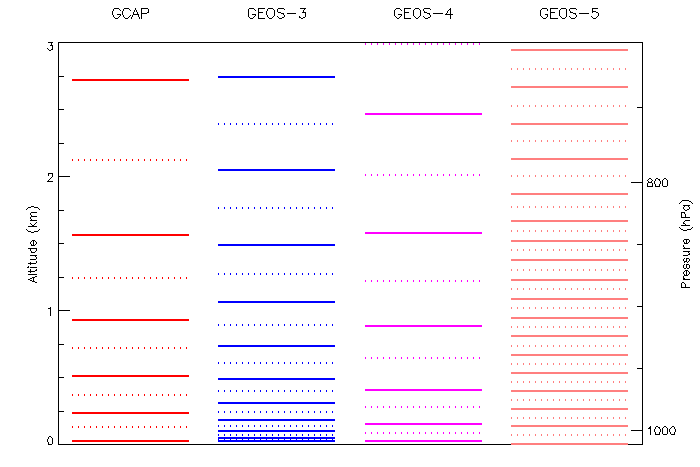
| 20:31, 14 November 2016 | Levels3km.png (file) |  |
5 KB | Bmy | Comparison of vertical levels up to 3km | 1 |
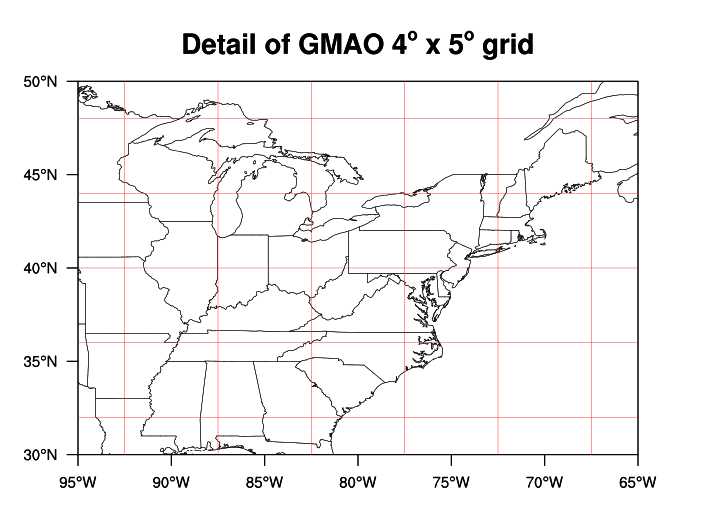
| 22:36, 10 November 2016 | Grid gmao4x5.png (file) |  |
59 KB | Bmy | GMAO 4 x 5 grid | 1 |
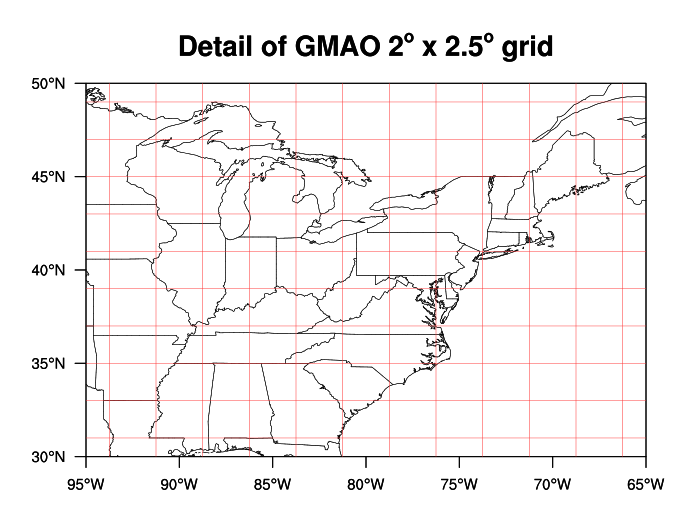
| 22:36, 10 November 2016 | Grid gmao2x25.png (file) |  |
64 KB | Bmy | GMAO 2 x 2.5 grid | 1 |
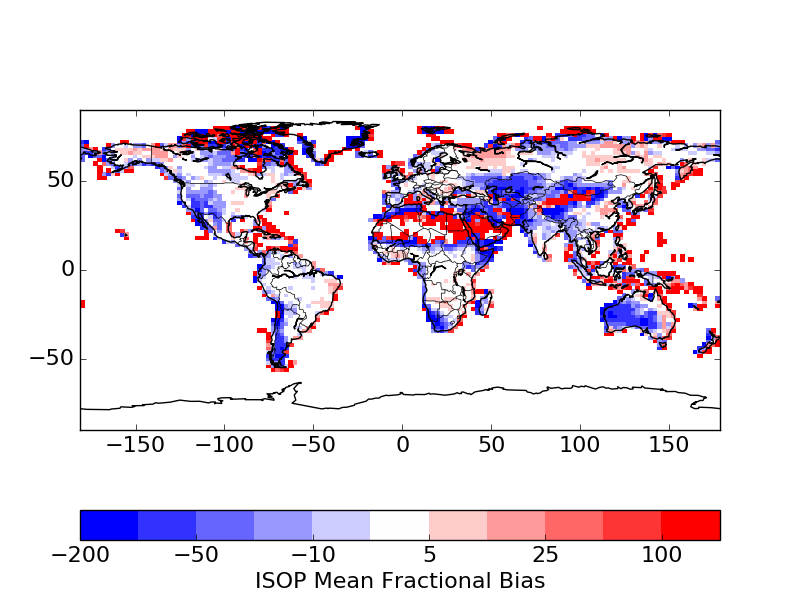
| 18:58, 4 November 2016 | MFB LAI 2010.png (file) |  |
119 KB | Barronh | Mean fractional bias between standard GEOS-Chem ISOP emissions and new Yuan product. | 1 |
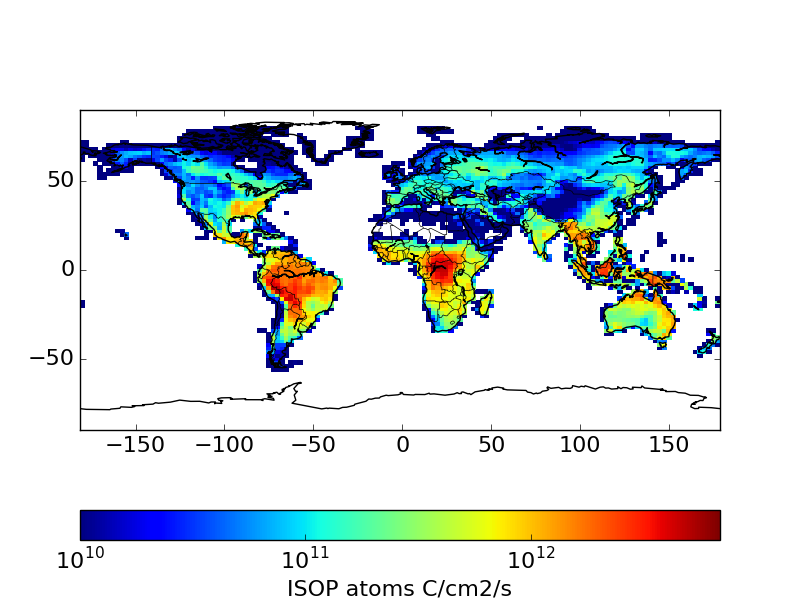
| 18:58, 4 November 2016 | STD LAI 2010.png (file) |  |
108 KB | Barronh | 1 | |
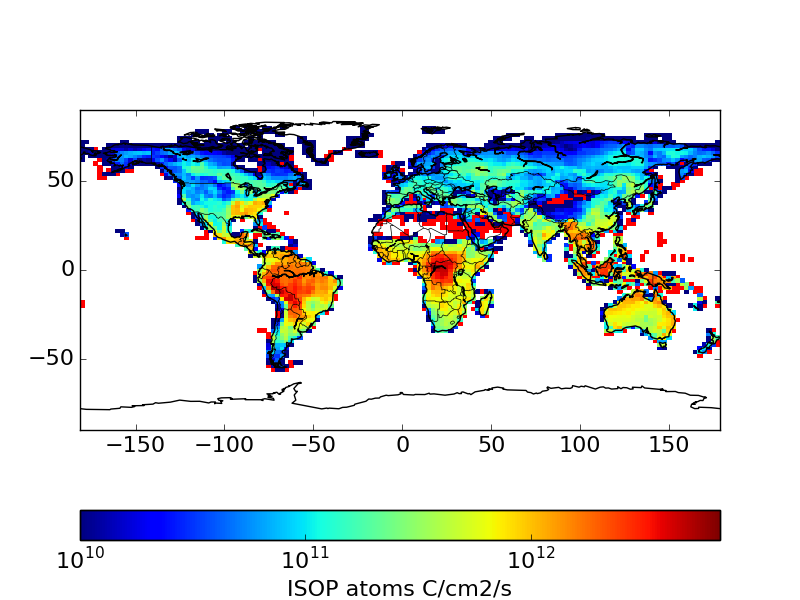
| 18:56, 4 November 2016 | BNU LAI 2010.png (file) |  |
106 KB | Barronh | 1 | |
| 16:00, 4 November 2016 | README LAI BNU.txt (file) | 5 KB | Barronh | Description of simulations with BNU LAI and the results. | 1 | |
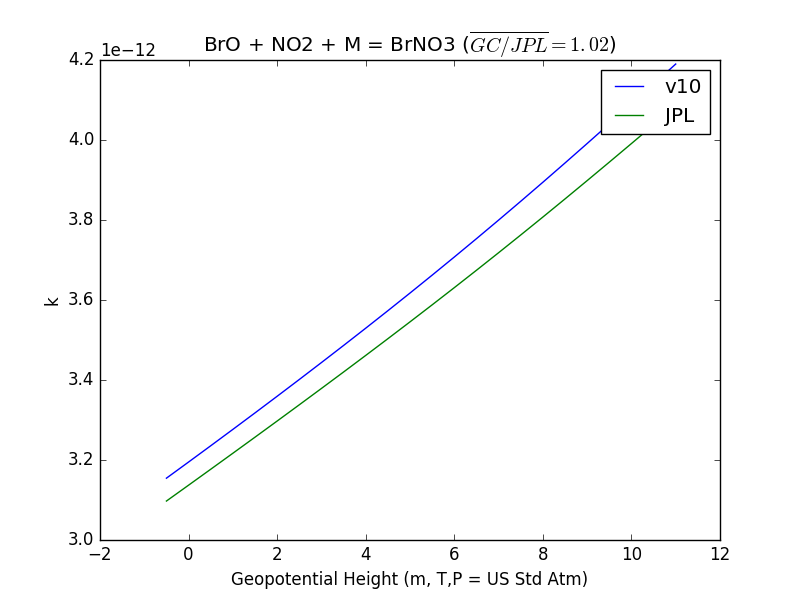
| 13:18, 5 October 2016 | JPL201510andGCv10 BrOplNO2plM eq BrNO3.png (file) |  |
40 KB | Tomas Sherwen | 1 | |
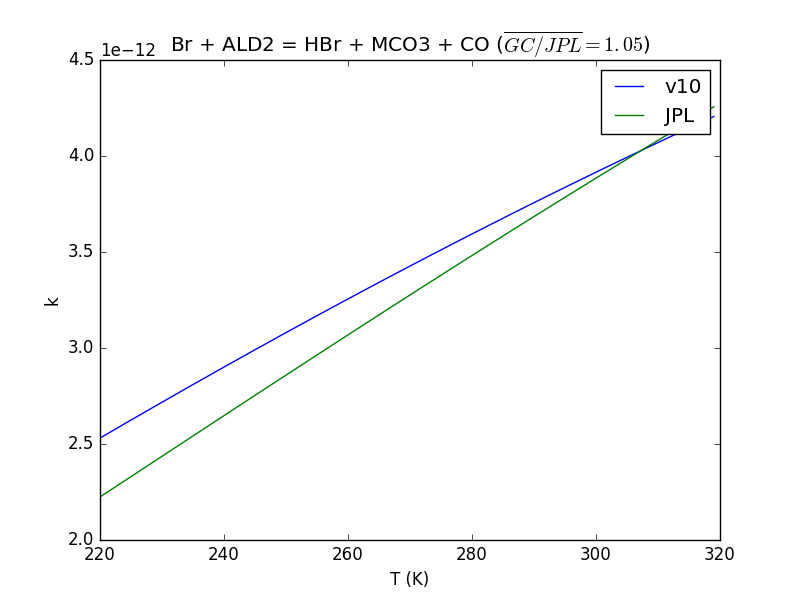
| 08:59, 15 August 2016 | JPL201510andGCv10 BrplALD2 eq HBrplMCO3plCO.png (file) |  |
36 KB | Tomas Sherwen | 1 | |
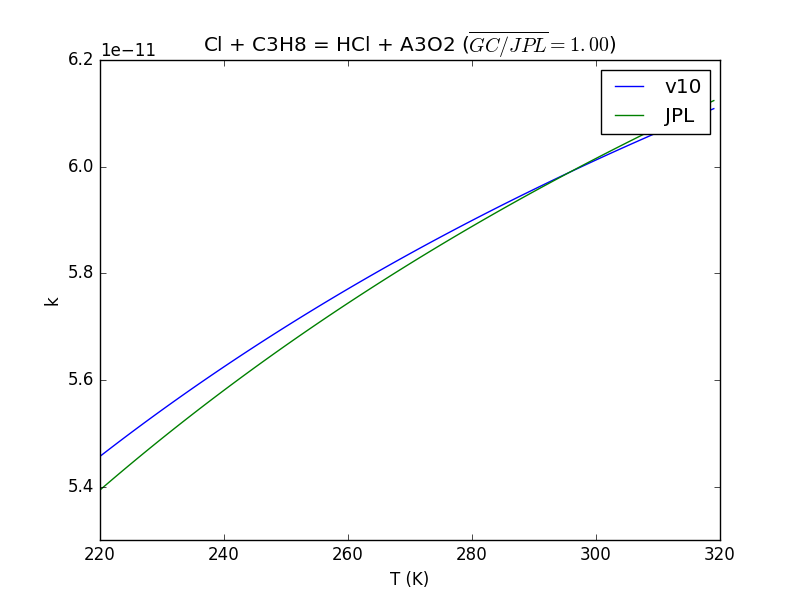
| 19:26, 12 August 2016 | JPL201510andGCv10 ClplC3H8 eq HClplA3O2.png (file) |  |
34 KB | Tomas Sherwen | 2 | |
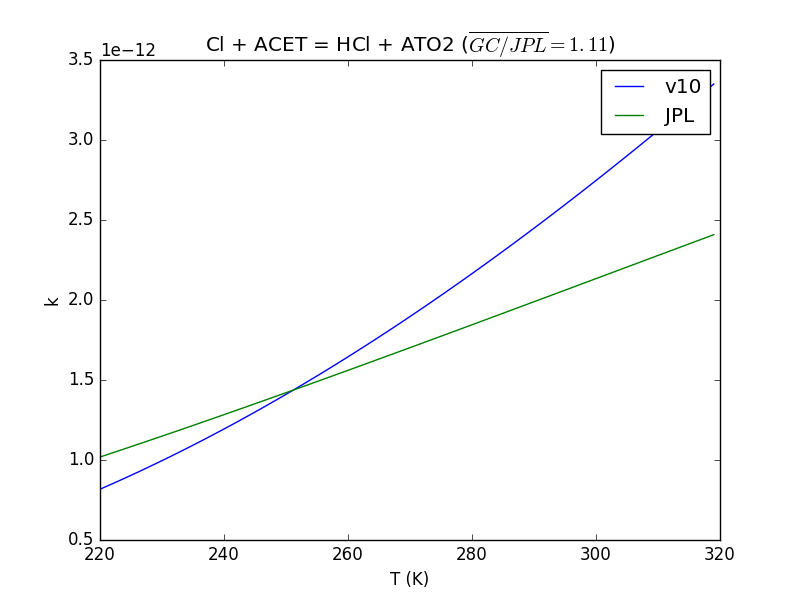
| 17:15, 12 August 2016 | JPL201510andGCv10 ClplACET eq HClplATO2.png (file) |  |
34 KB | Tomas Sherwen | 1 | |
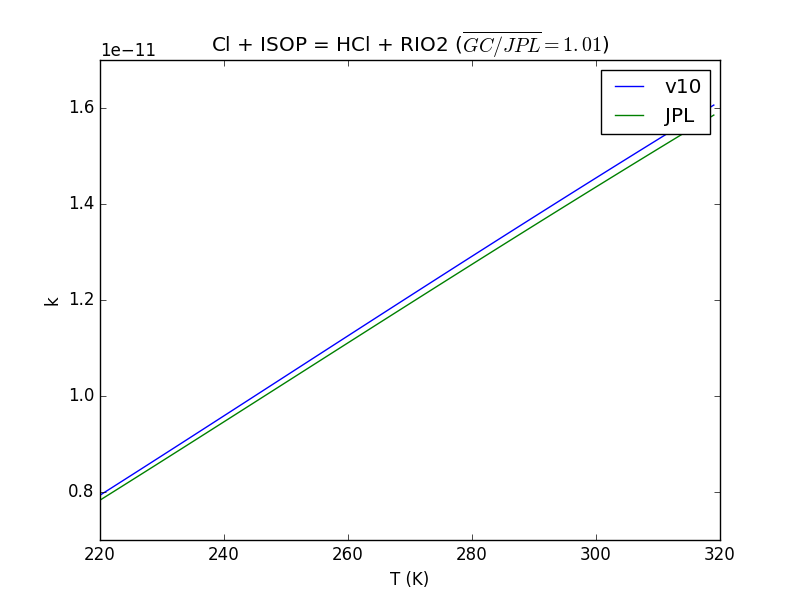
| 17:13, 12 August 2016 | JPL201510andGCv10 ClplISOP eq HClplRIO2.png (file) |  |
34 KB | Tomas Sherwen | 1 | |
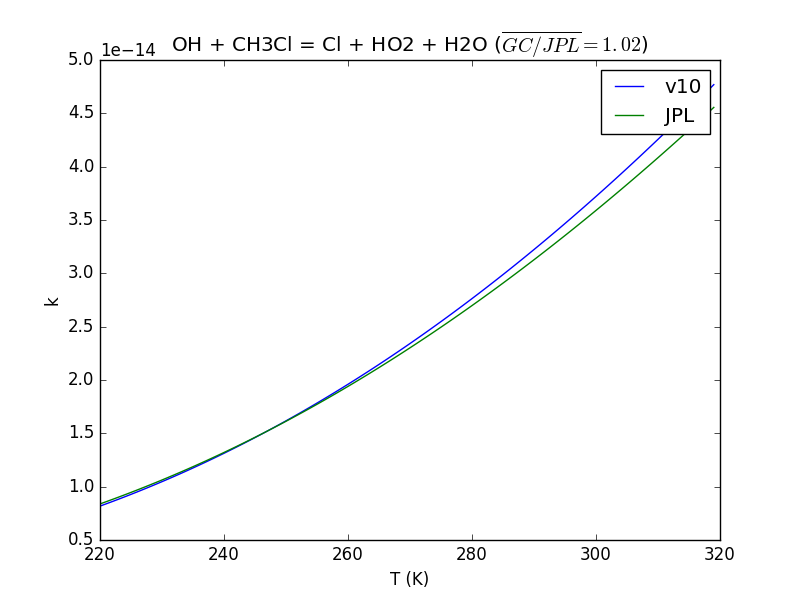
| 17:10, 12 August 2016 | JPL201510andGCv10 OHplCH3Cl eq ClplHO2plH2O.png (file) |  |
36 KB | Tomas Sherwen | 1 | |
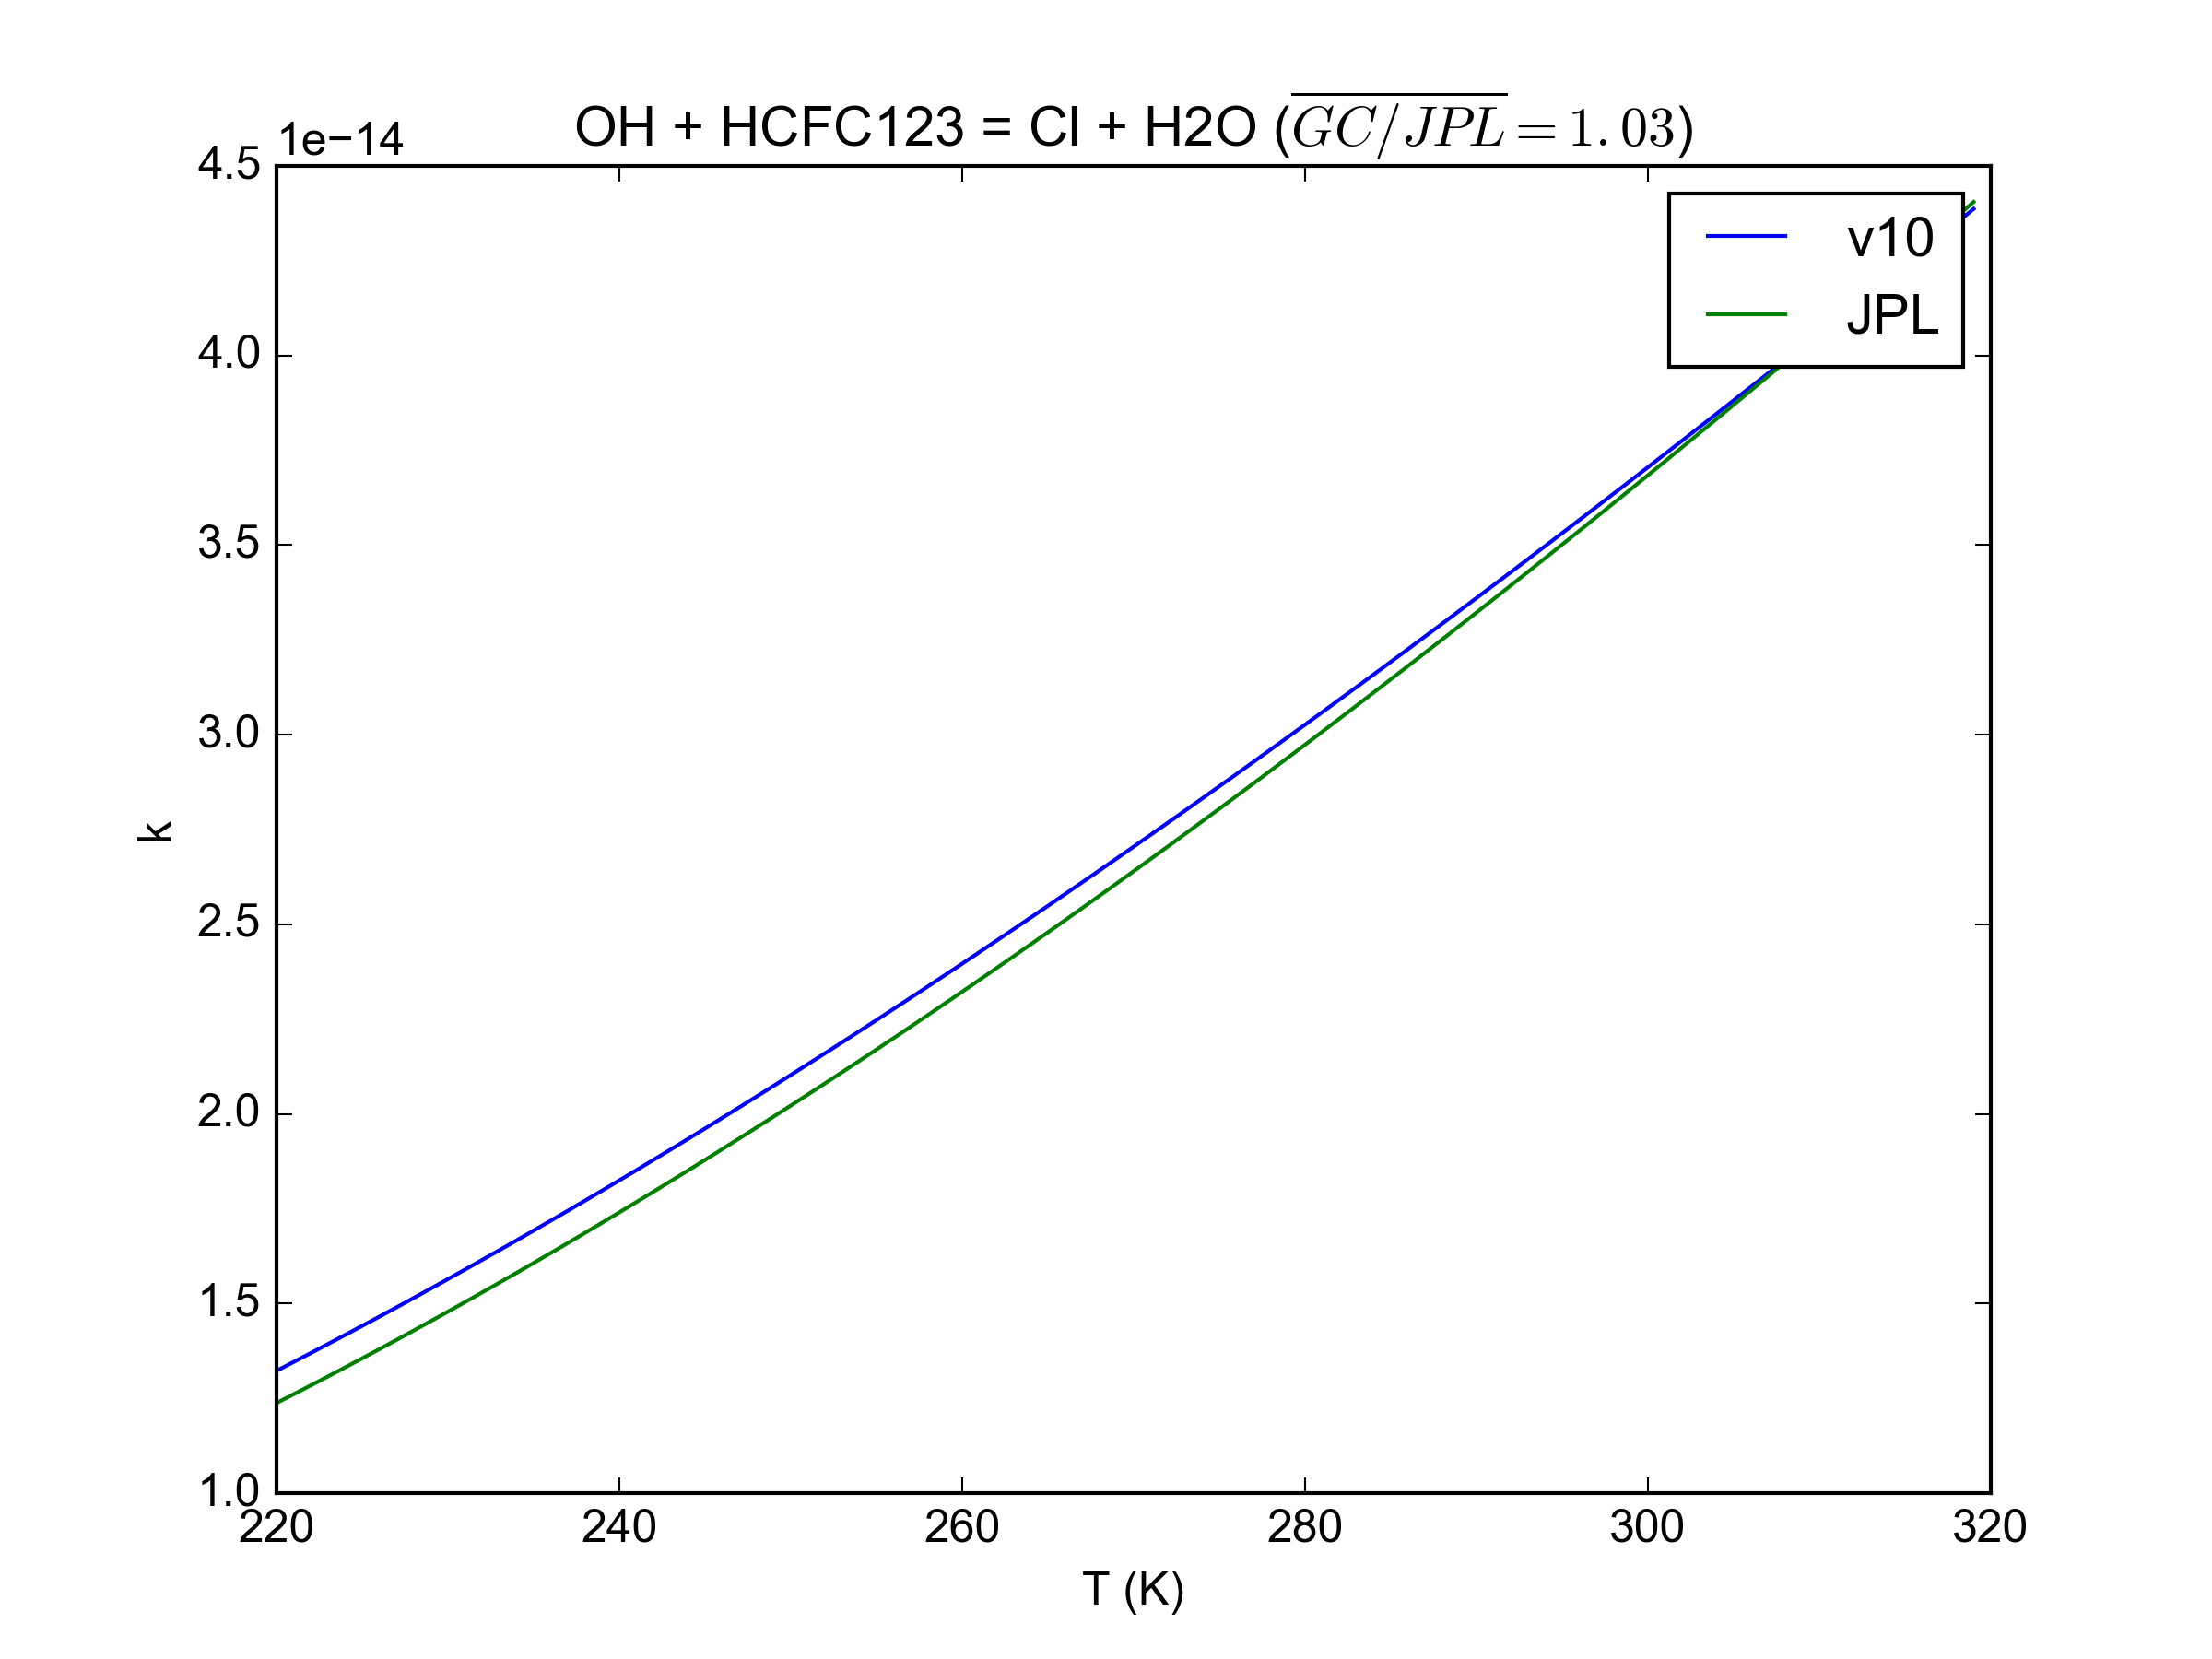
| 21:03, 13 May 2016 | JPL201510andGCv10 OHplHCFC123 eq ClplH2O.png (file) |  |
139 KB | Barronh | 1 | |
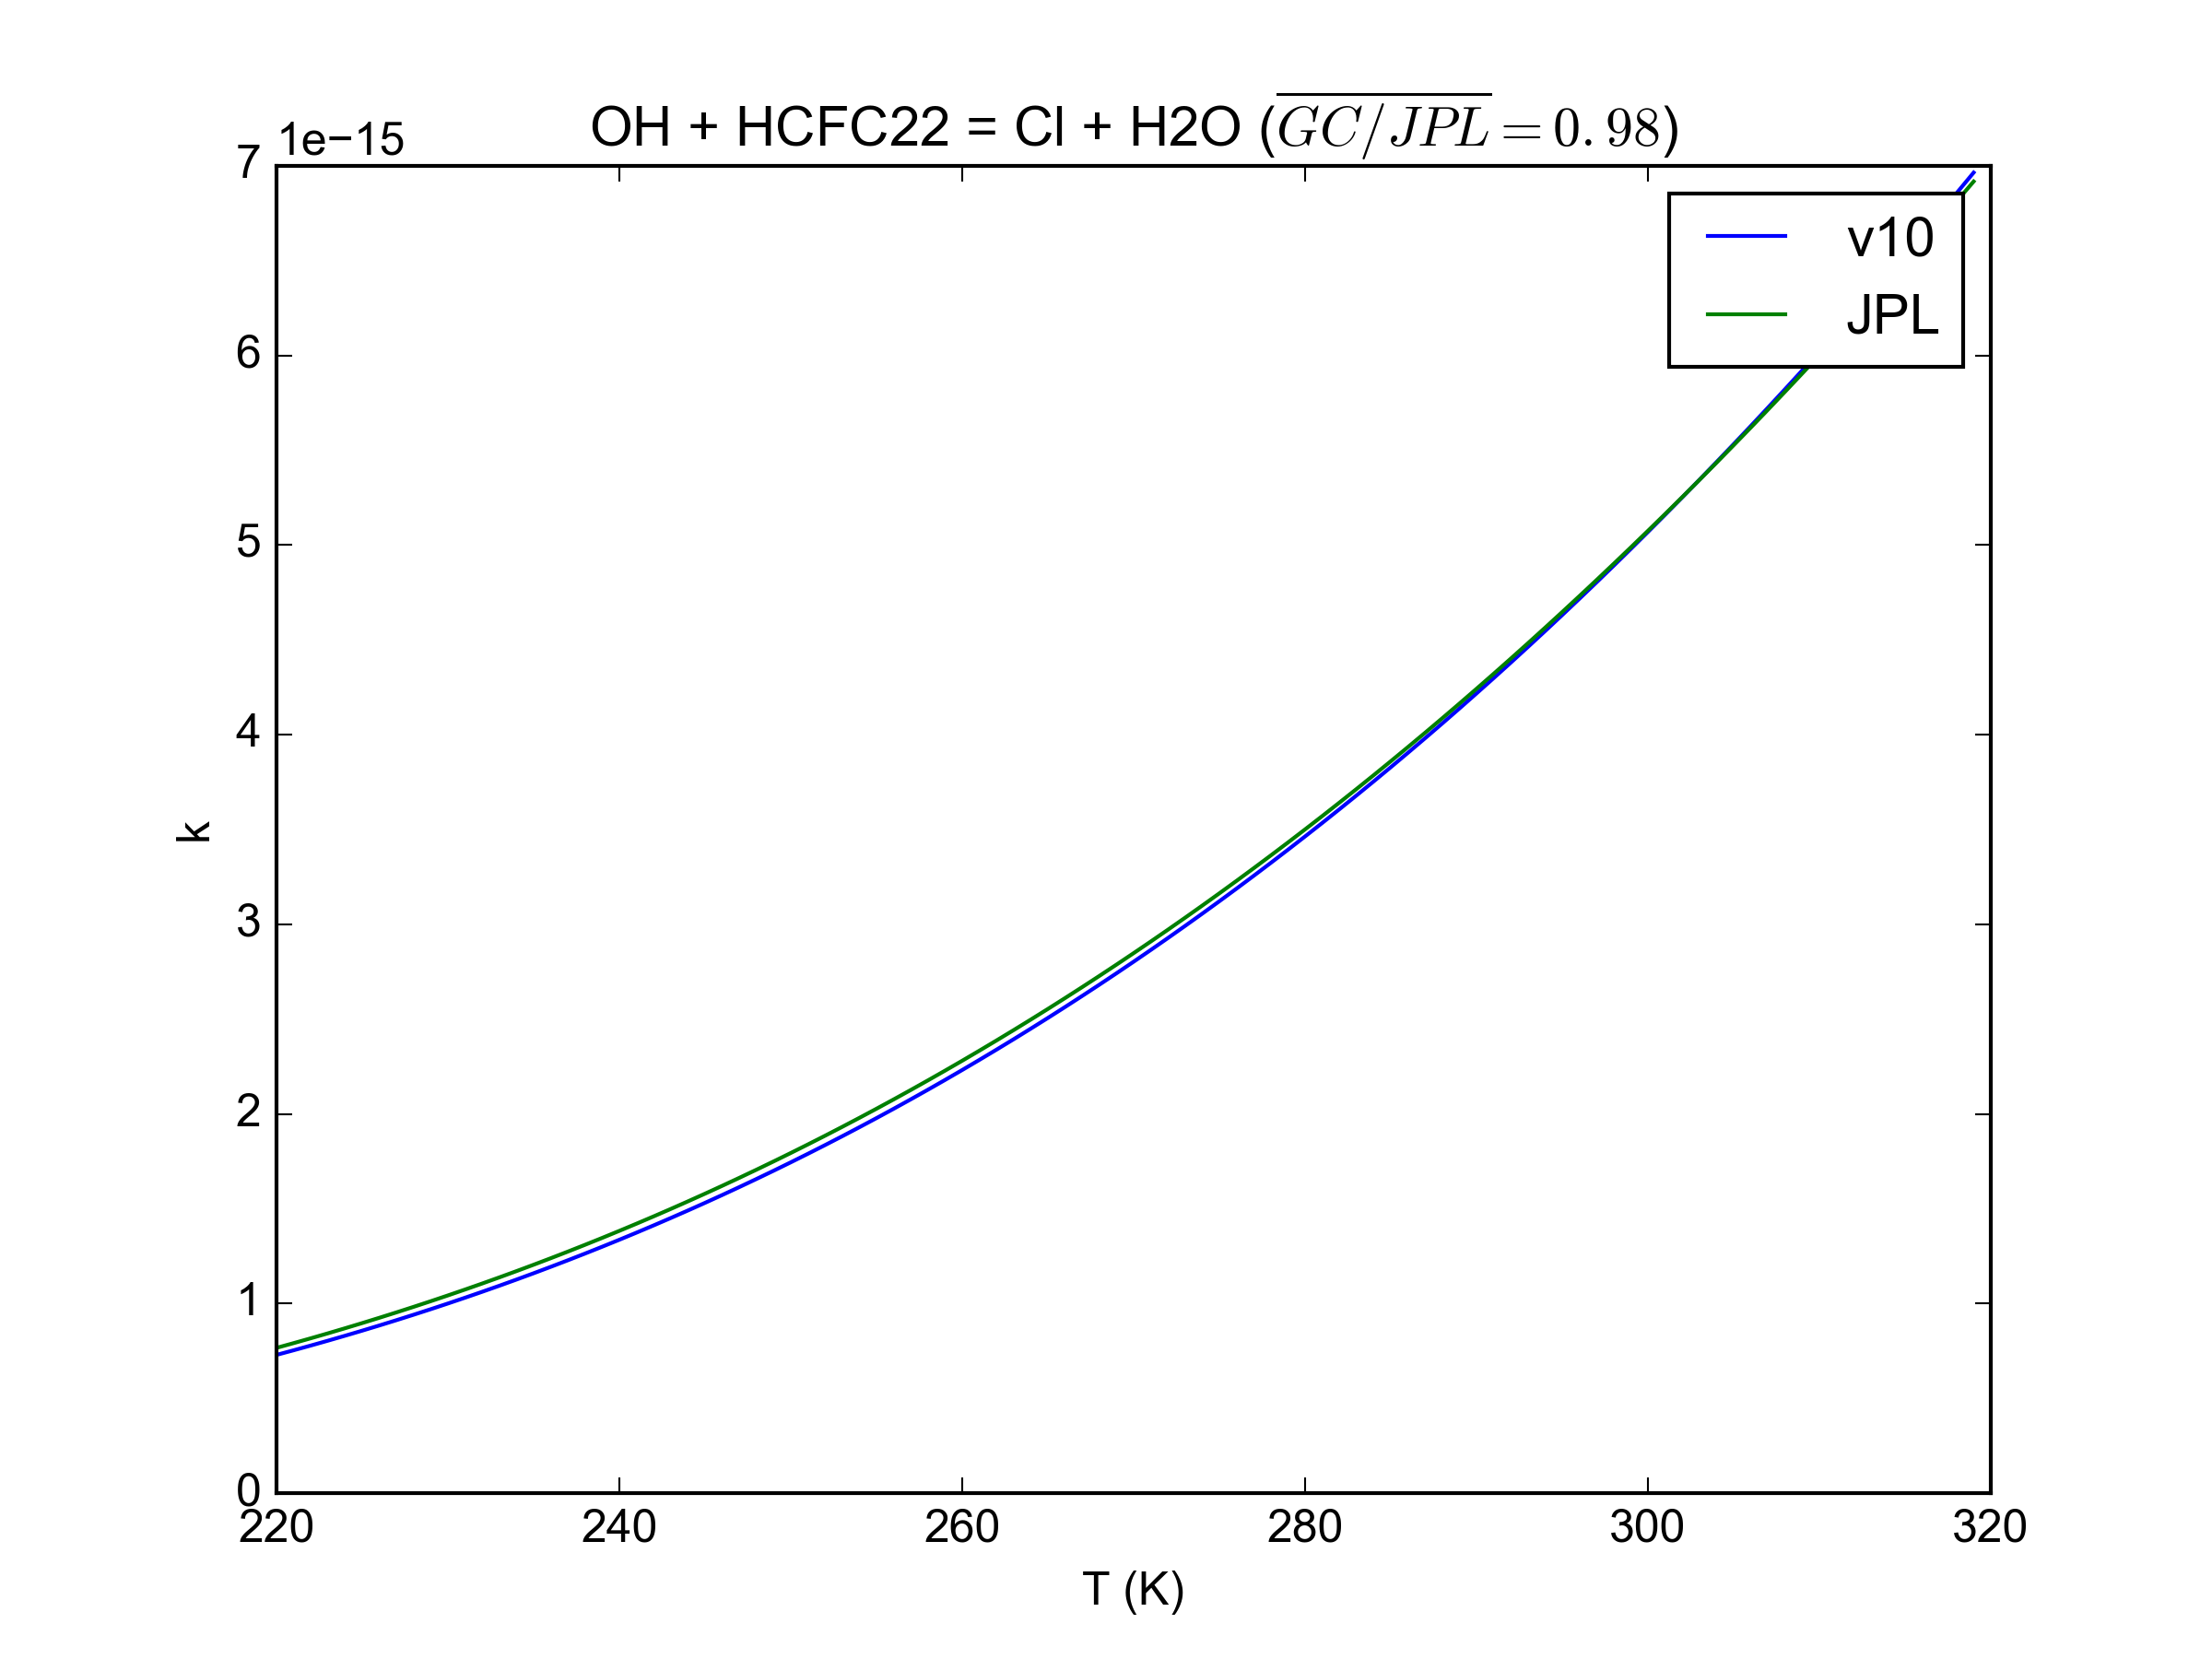
| 21:02, 13 May 2016 | JPL201510andGCv10 OHplHCFC22 eq ClplH2O.png (file) |  |
123 KB | Barronh | 1 | |
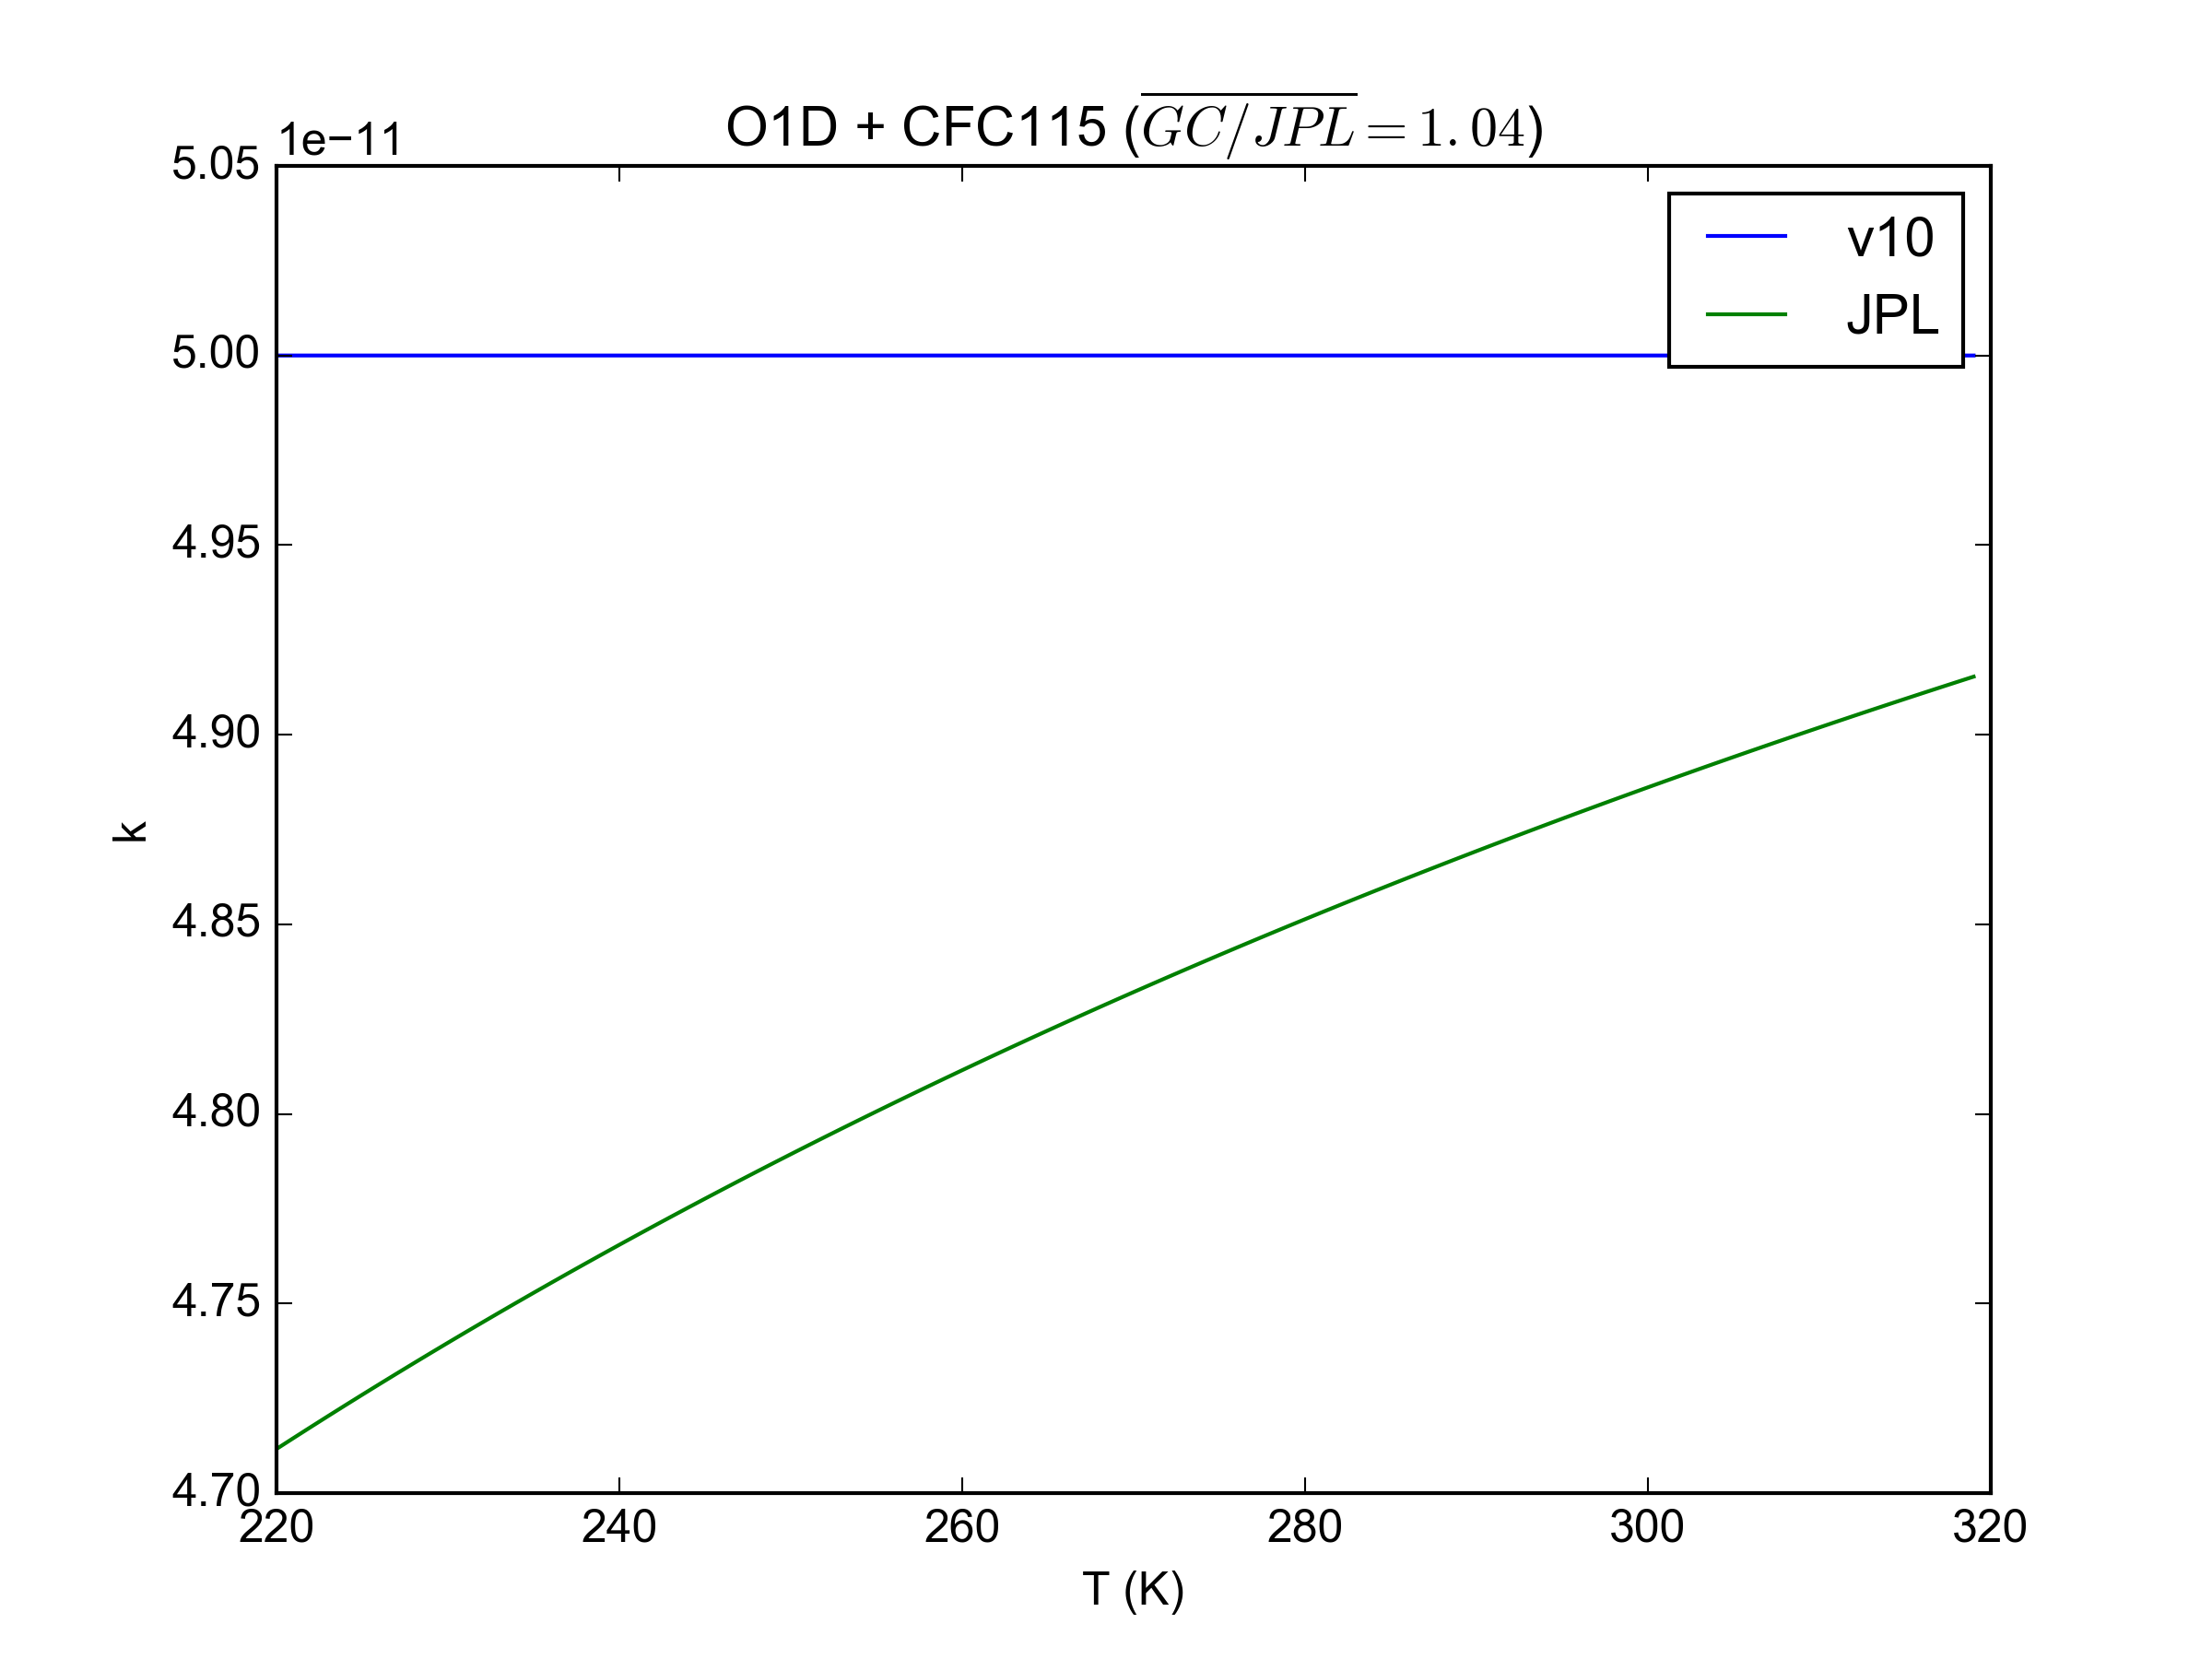
| 21:01, 13 May 2016 | JPL201510andGCv10 O1DplCFC115.png (file) |  |
118 KB | Barronh | 1 | |
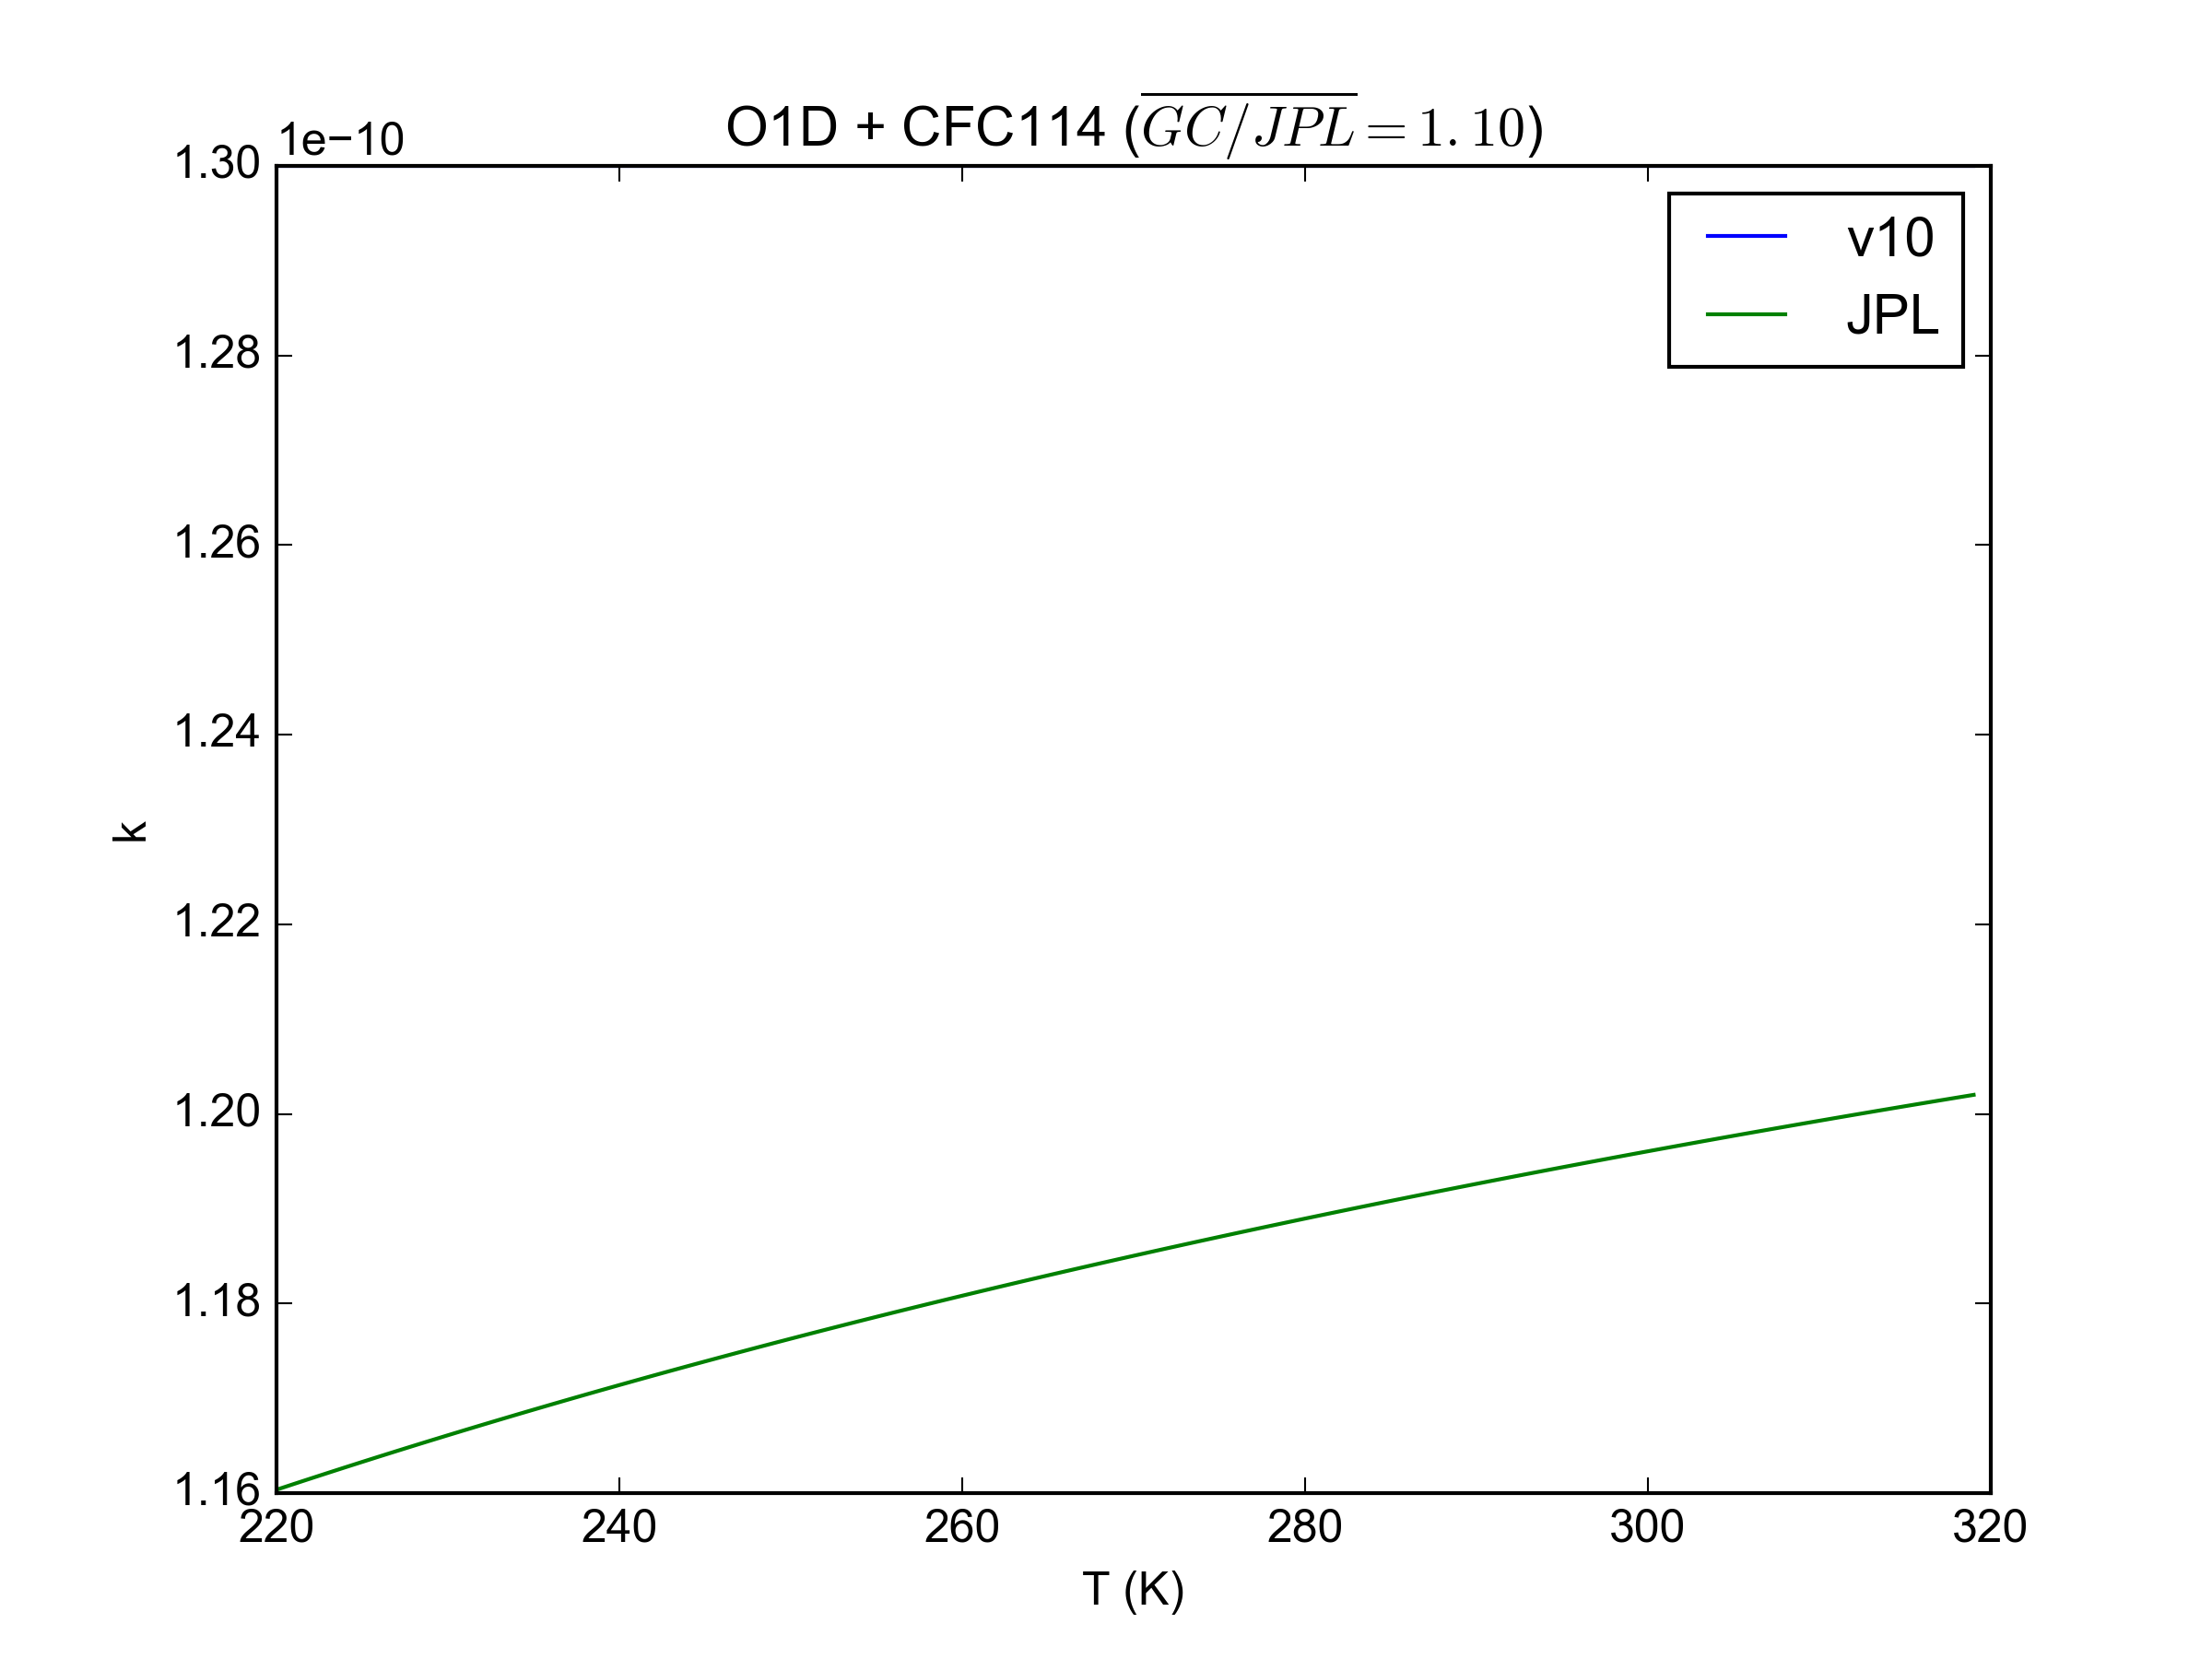
| 21:00, 13 May 2016 | JPL201510andGCv10 O1DplCFC114.png (file) |  |
99 KB | Barronh | 1 | |
| 20:59, 13 May 2016 | JPL201510andGCv10 O1DplCFC113.png (file) |  |
93 KB | Barronh | 1 | |
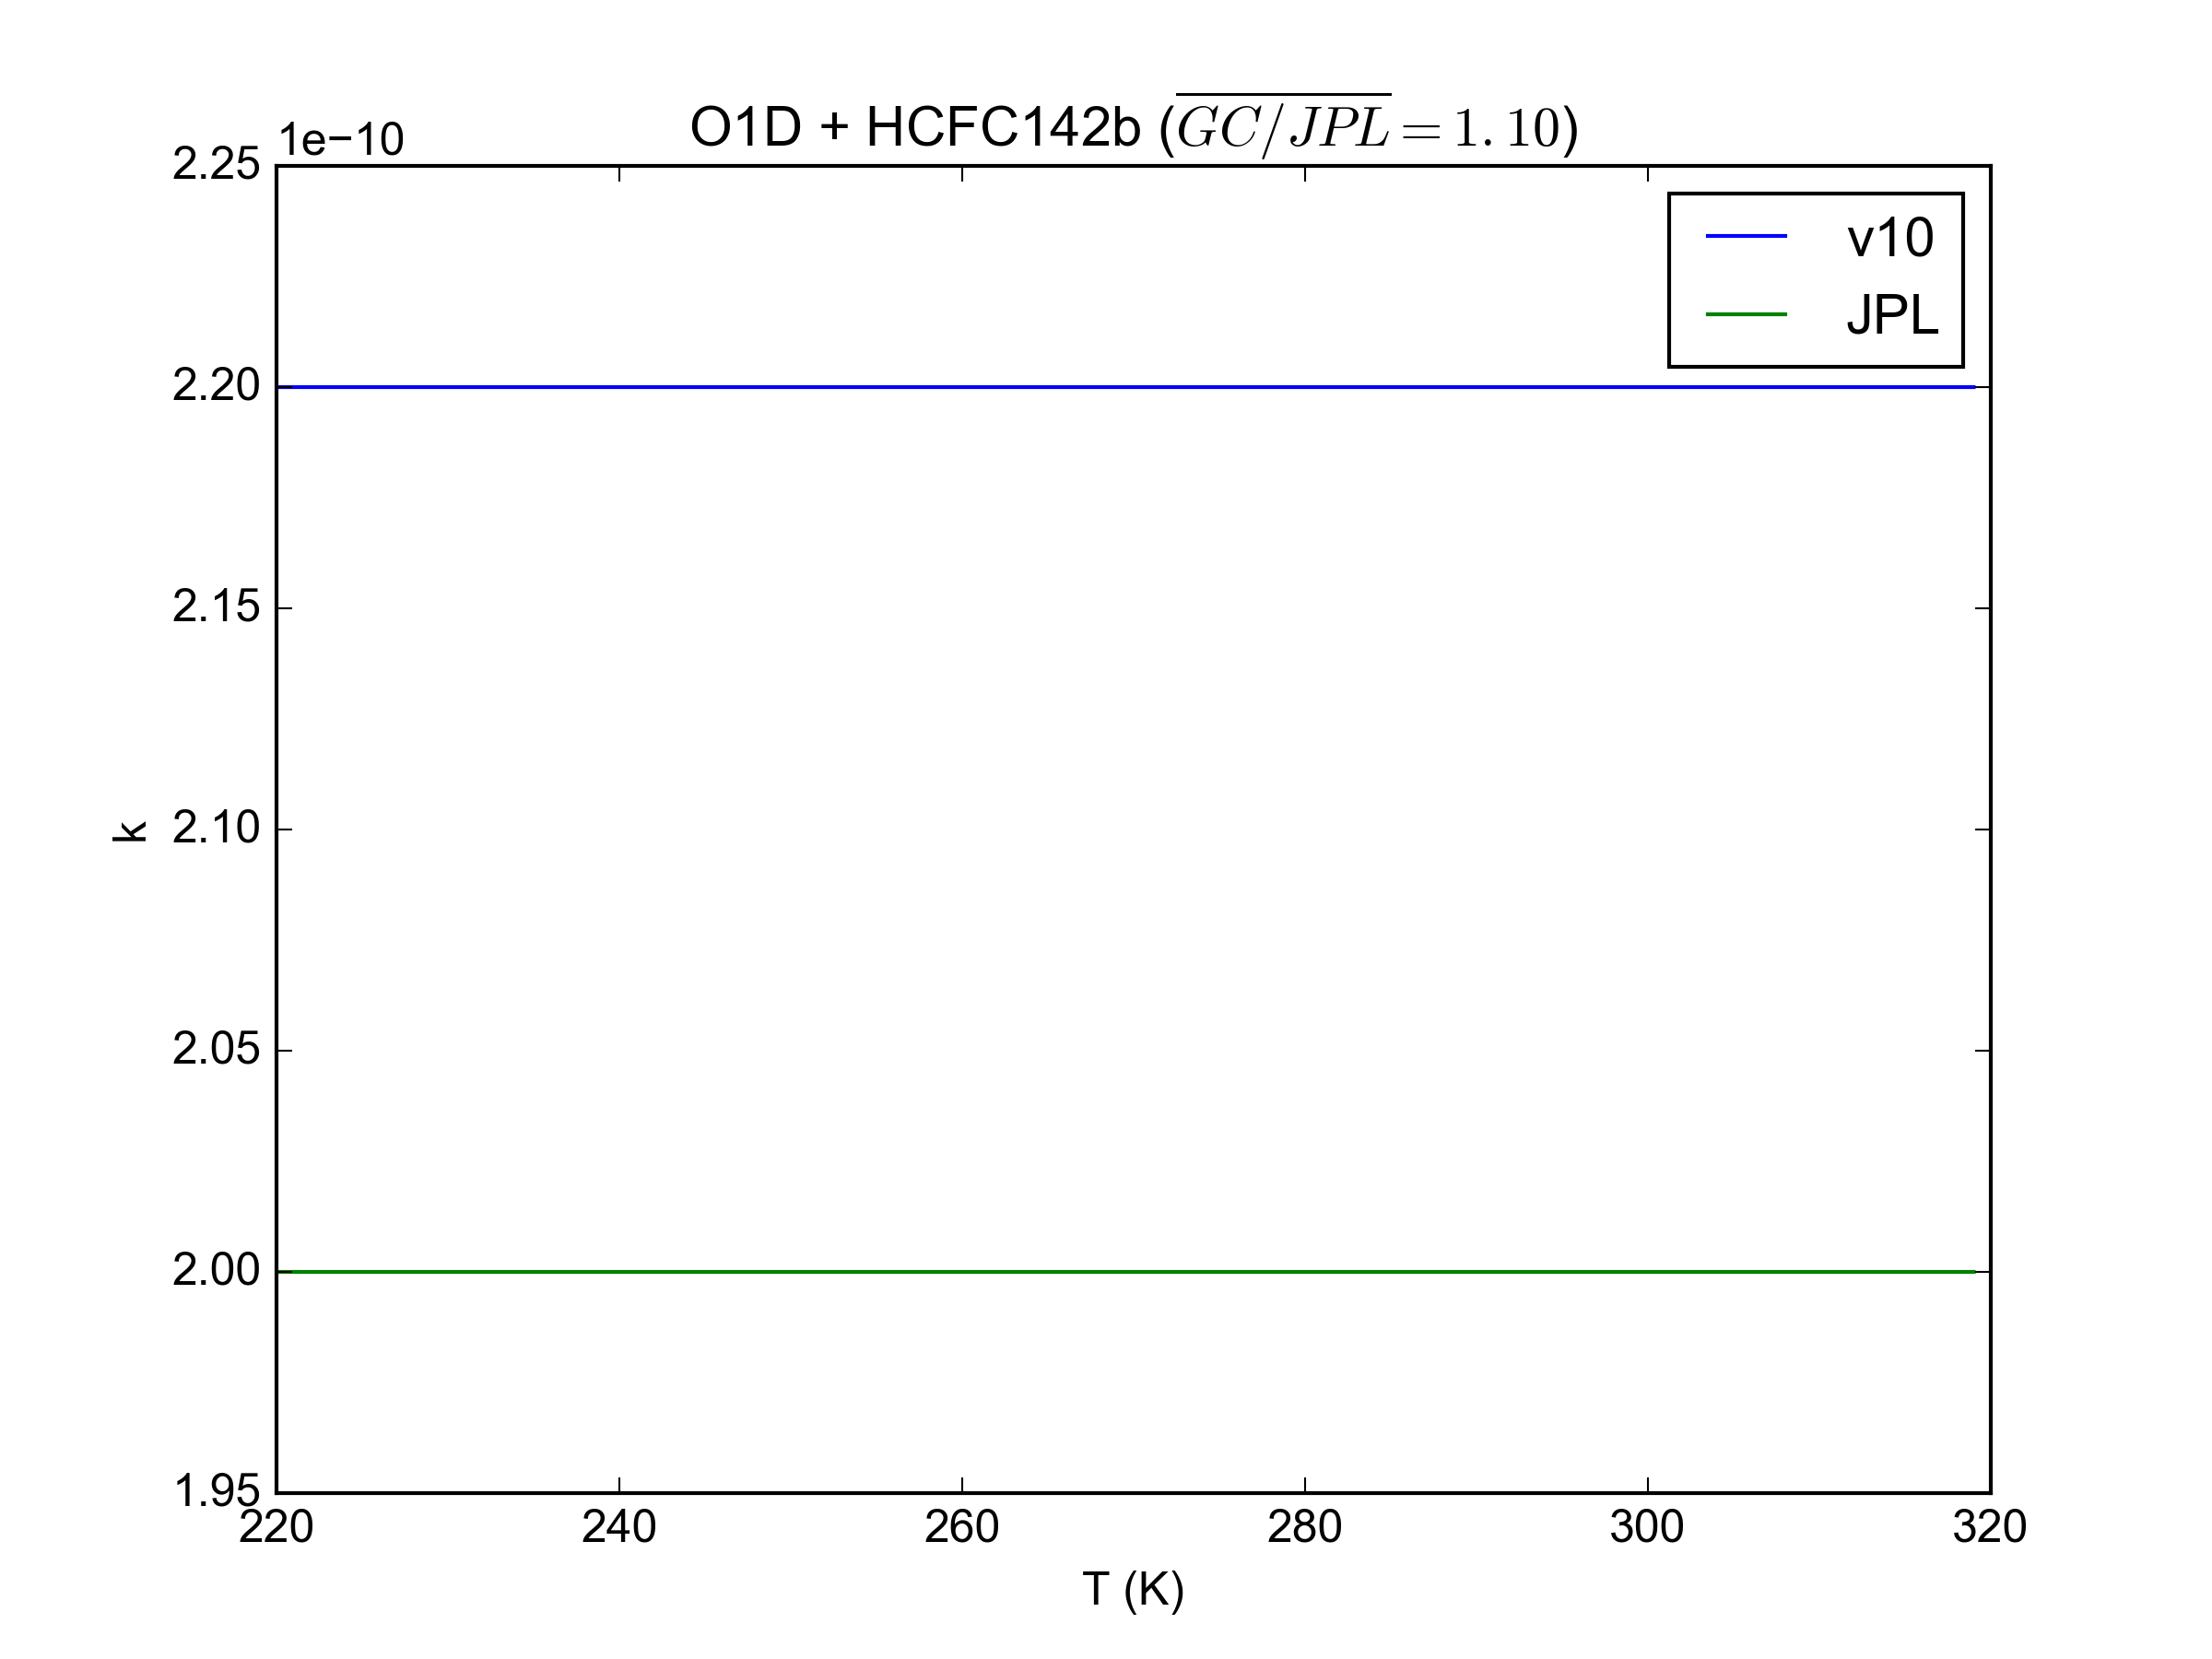
| 20:59, 13 May 2016 | JPL201510andGCv10 O1DplHCFC142b.png (file) |  |
85 KB | Barronh | 1 | |
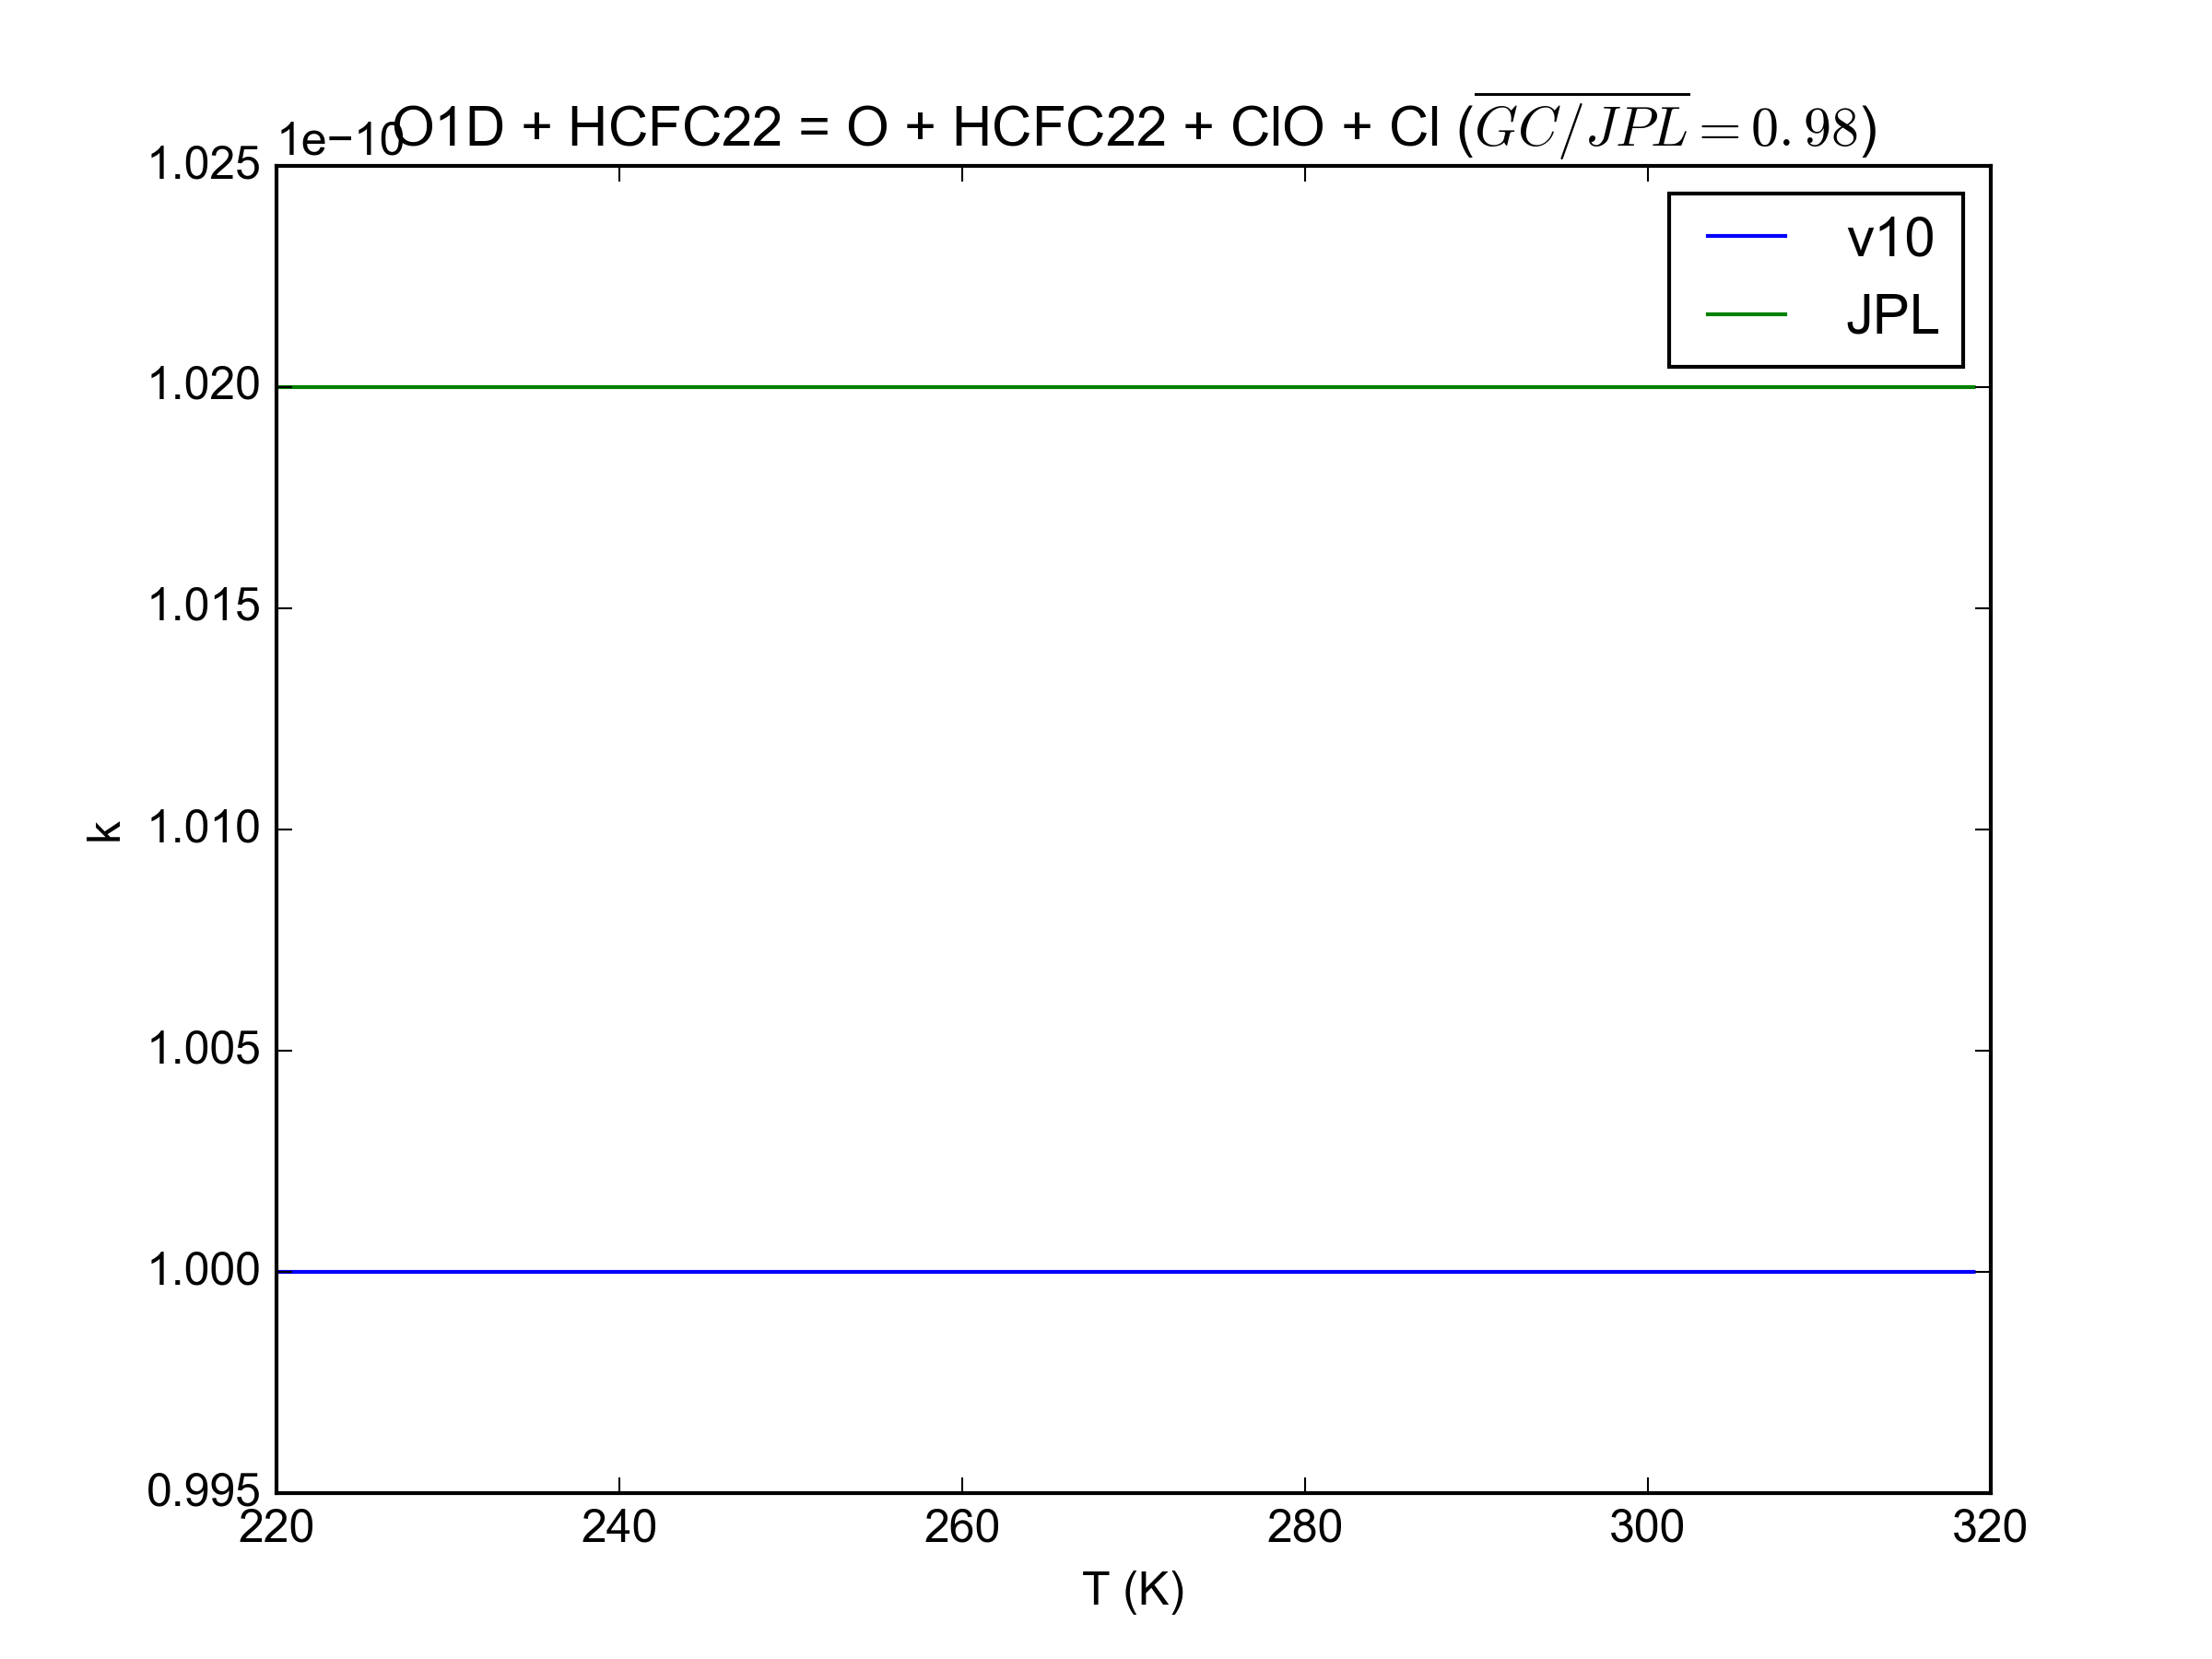
| 20:58, 13 May 2016 | JPL201510andGCv10 O1DplHCFC22 eq OplHCFC22plClOplCl.png (file) |  |
90 KB | Barronh | 1 | |
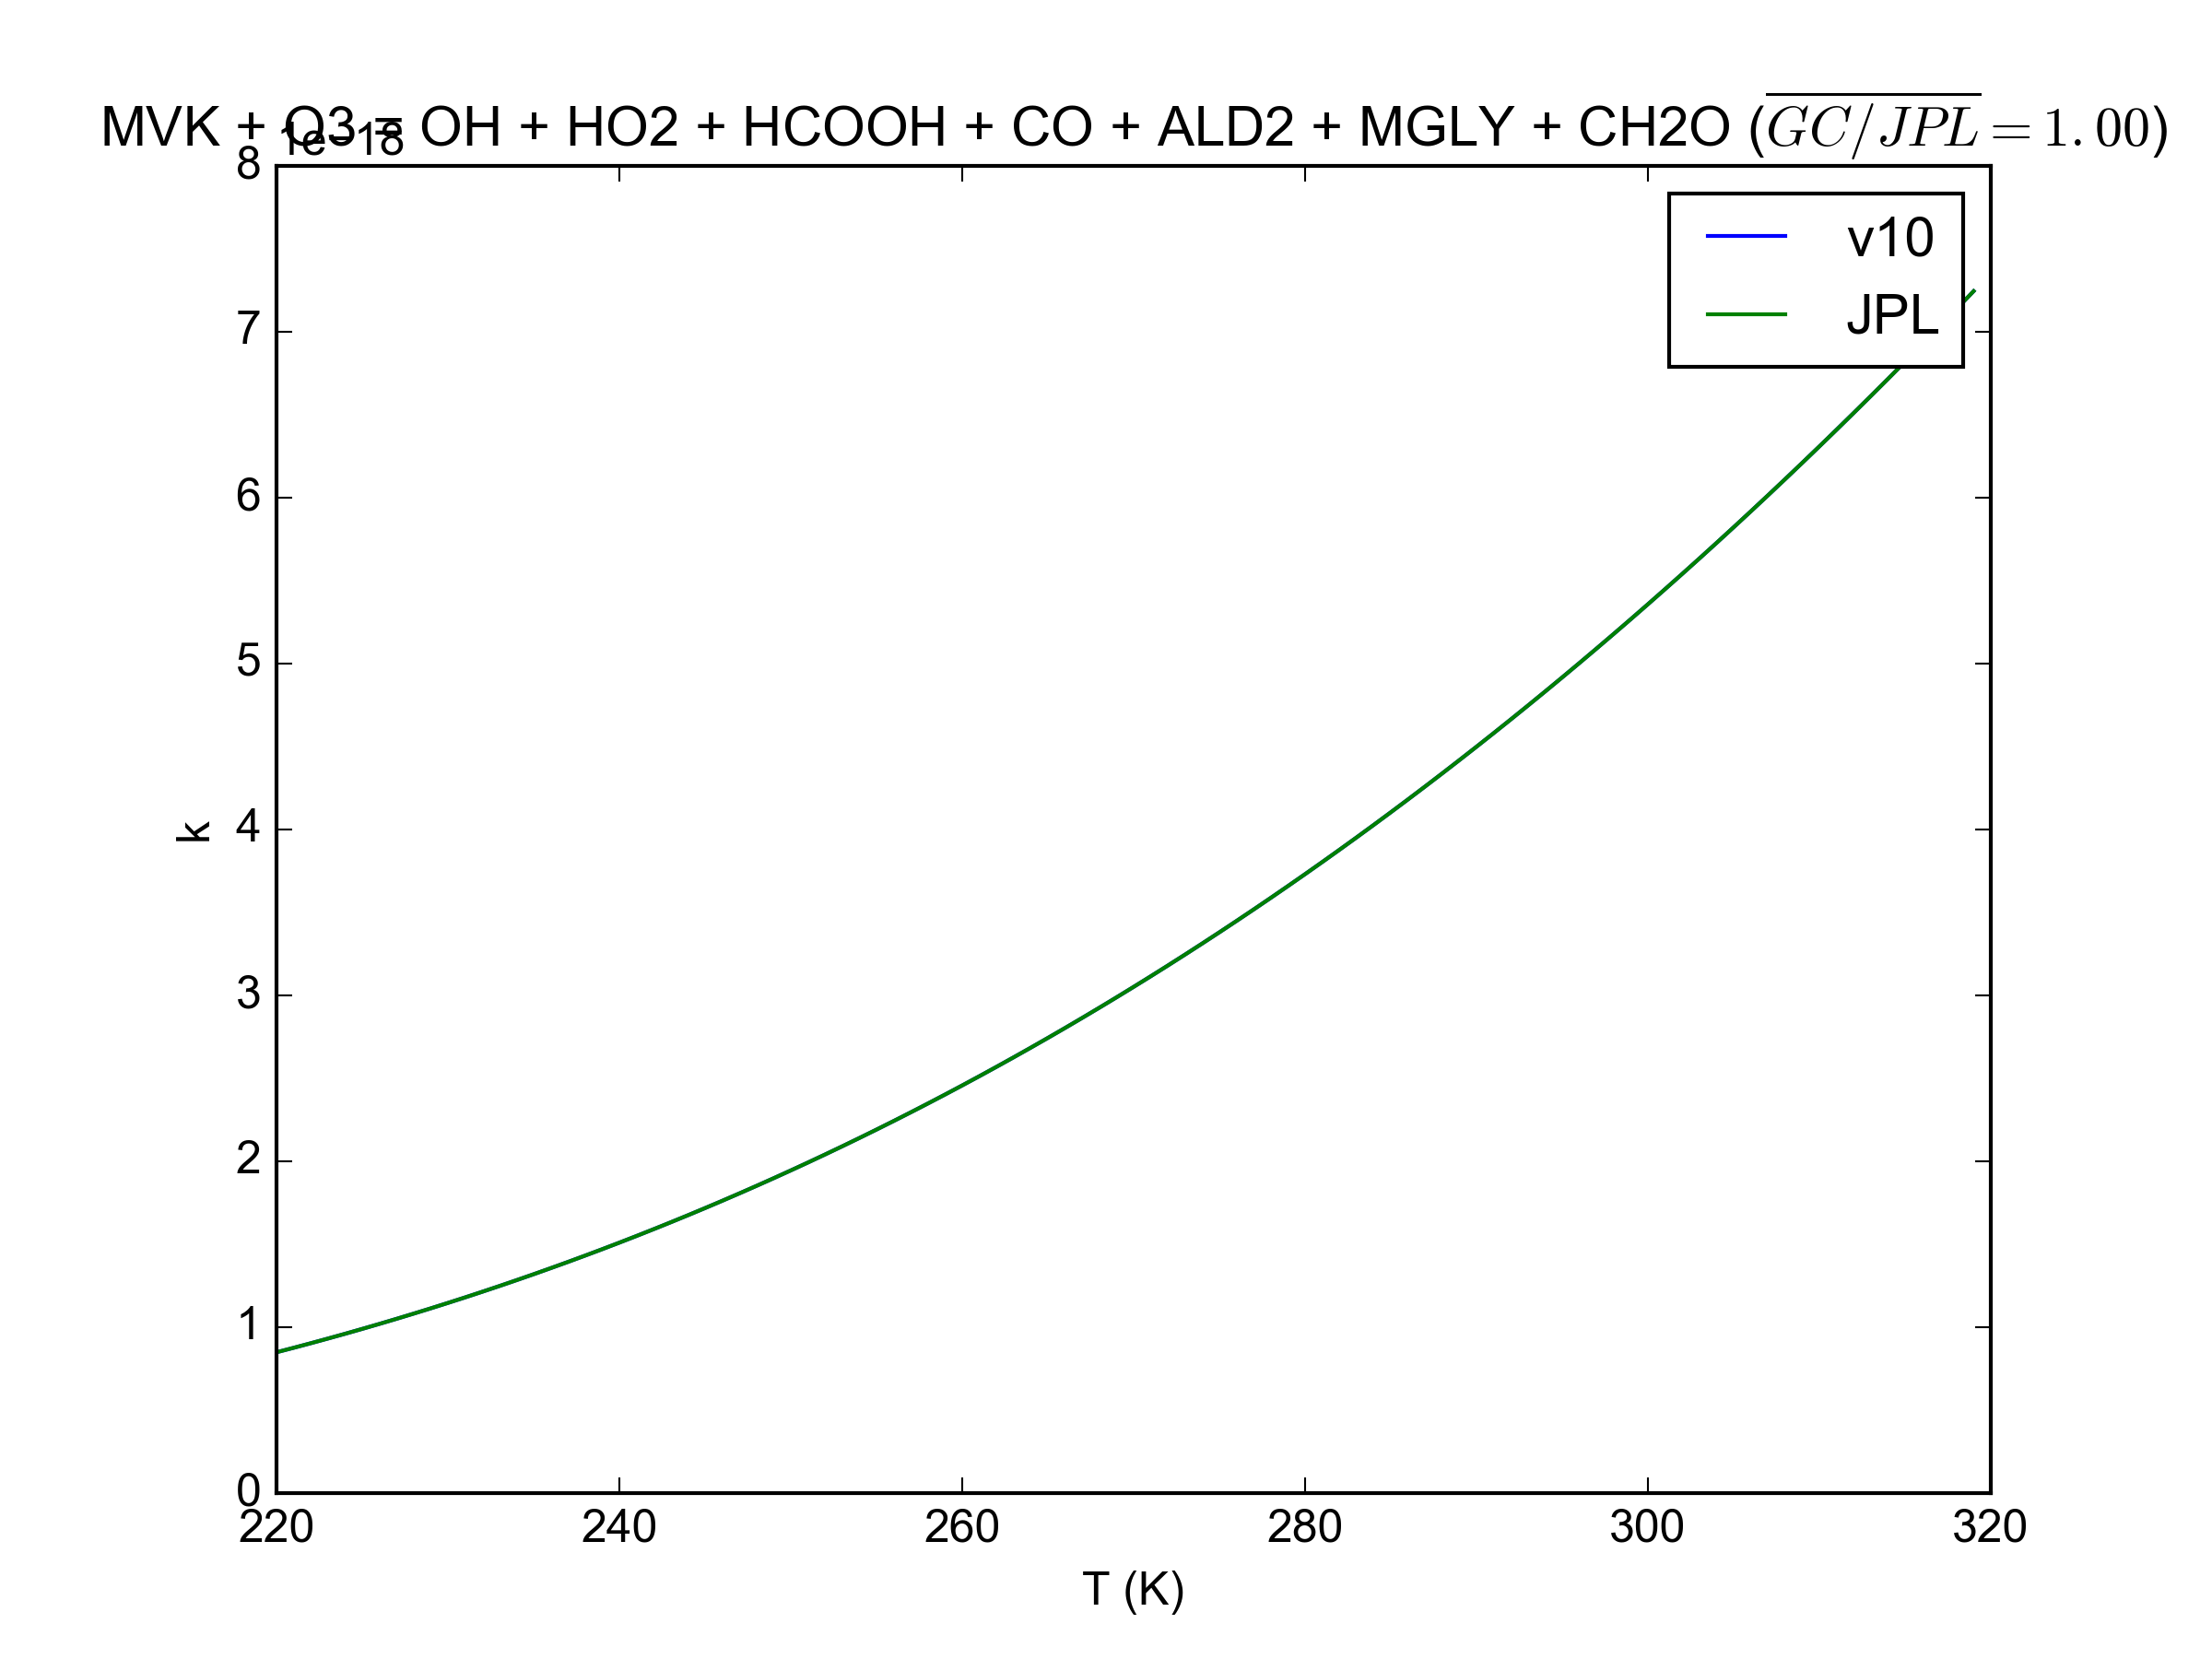
| 20:24, 3 May 2016 | JPL201510andGCv10 MVKplO3 eq OHplHO2plHCOOHplCOplALD2plMGLYplCH2O.png (file) |  |
114 KB | Barronh | 1 | |
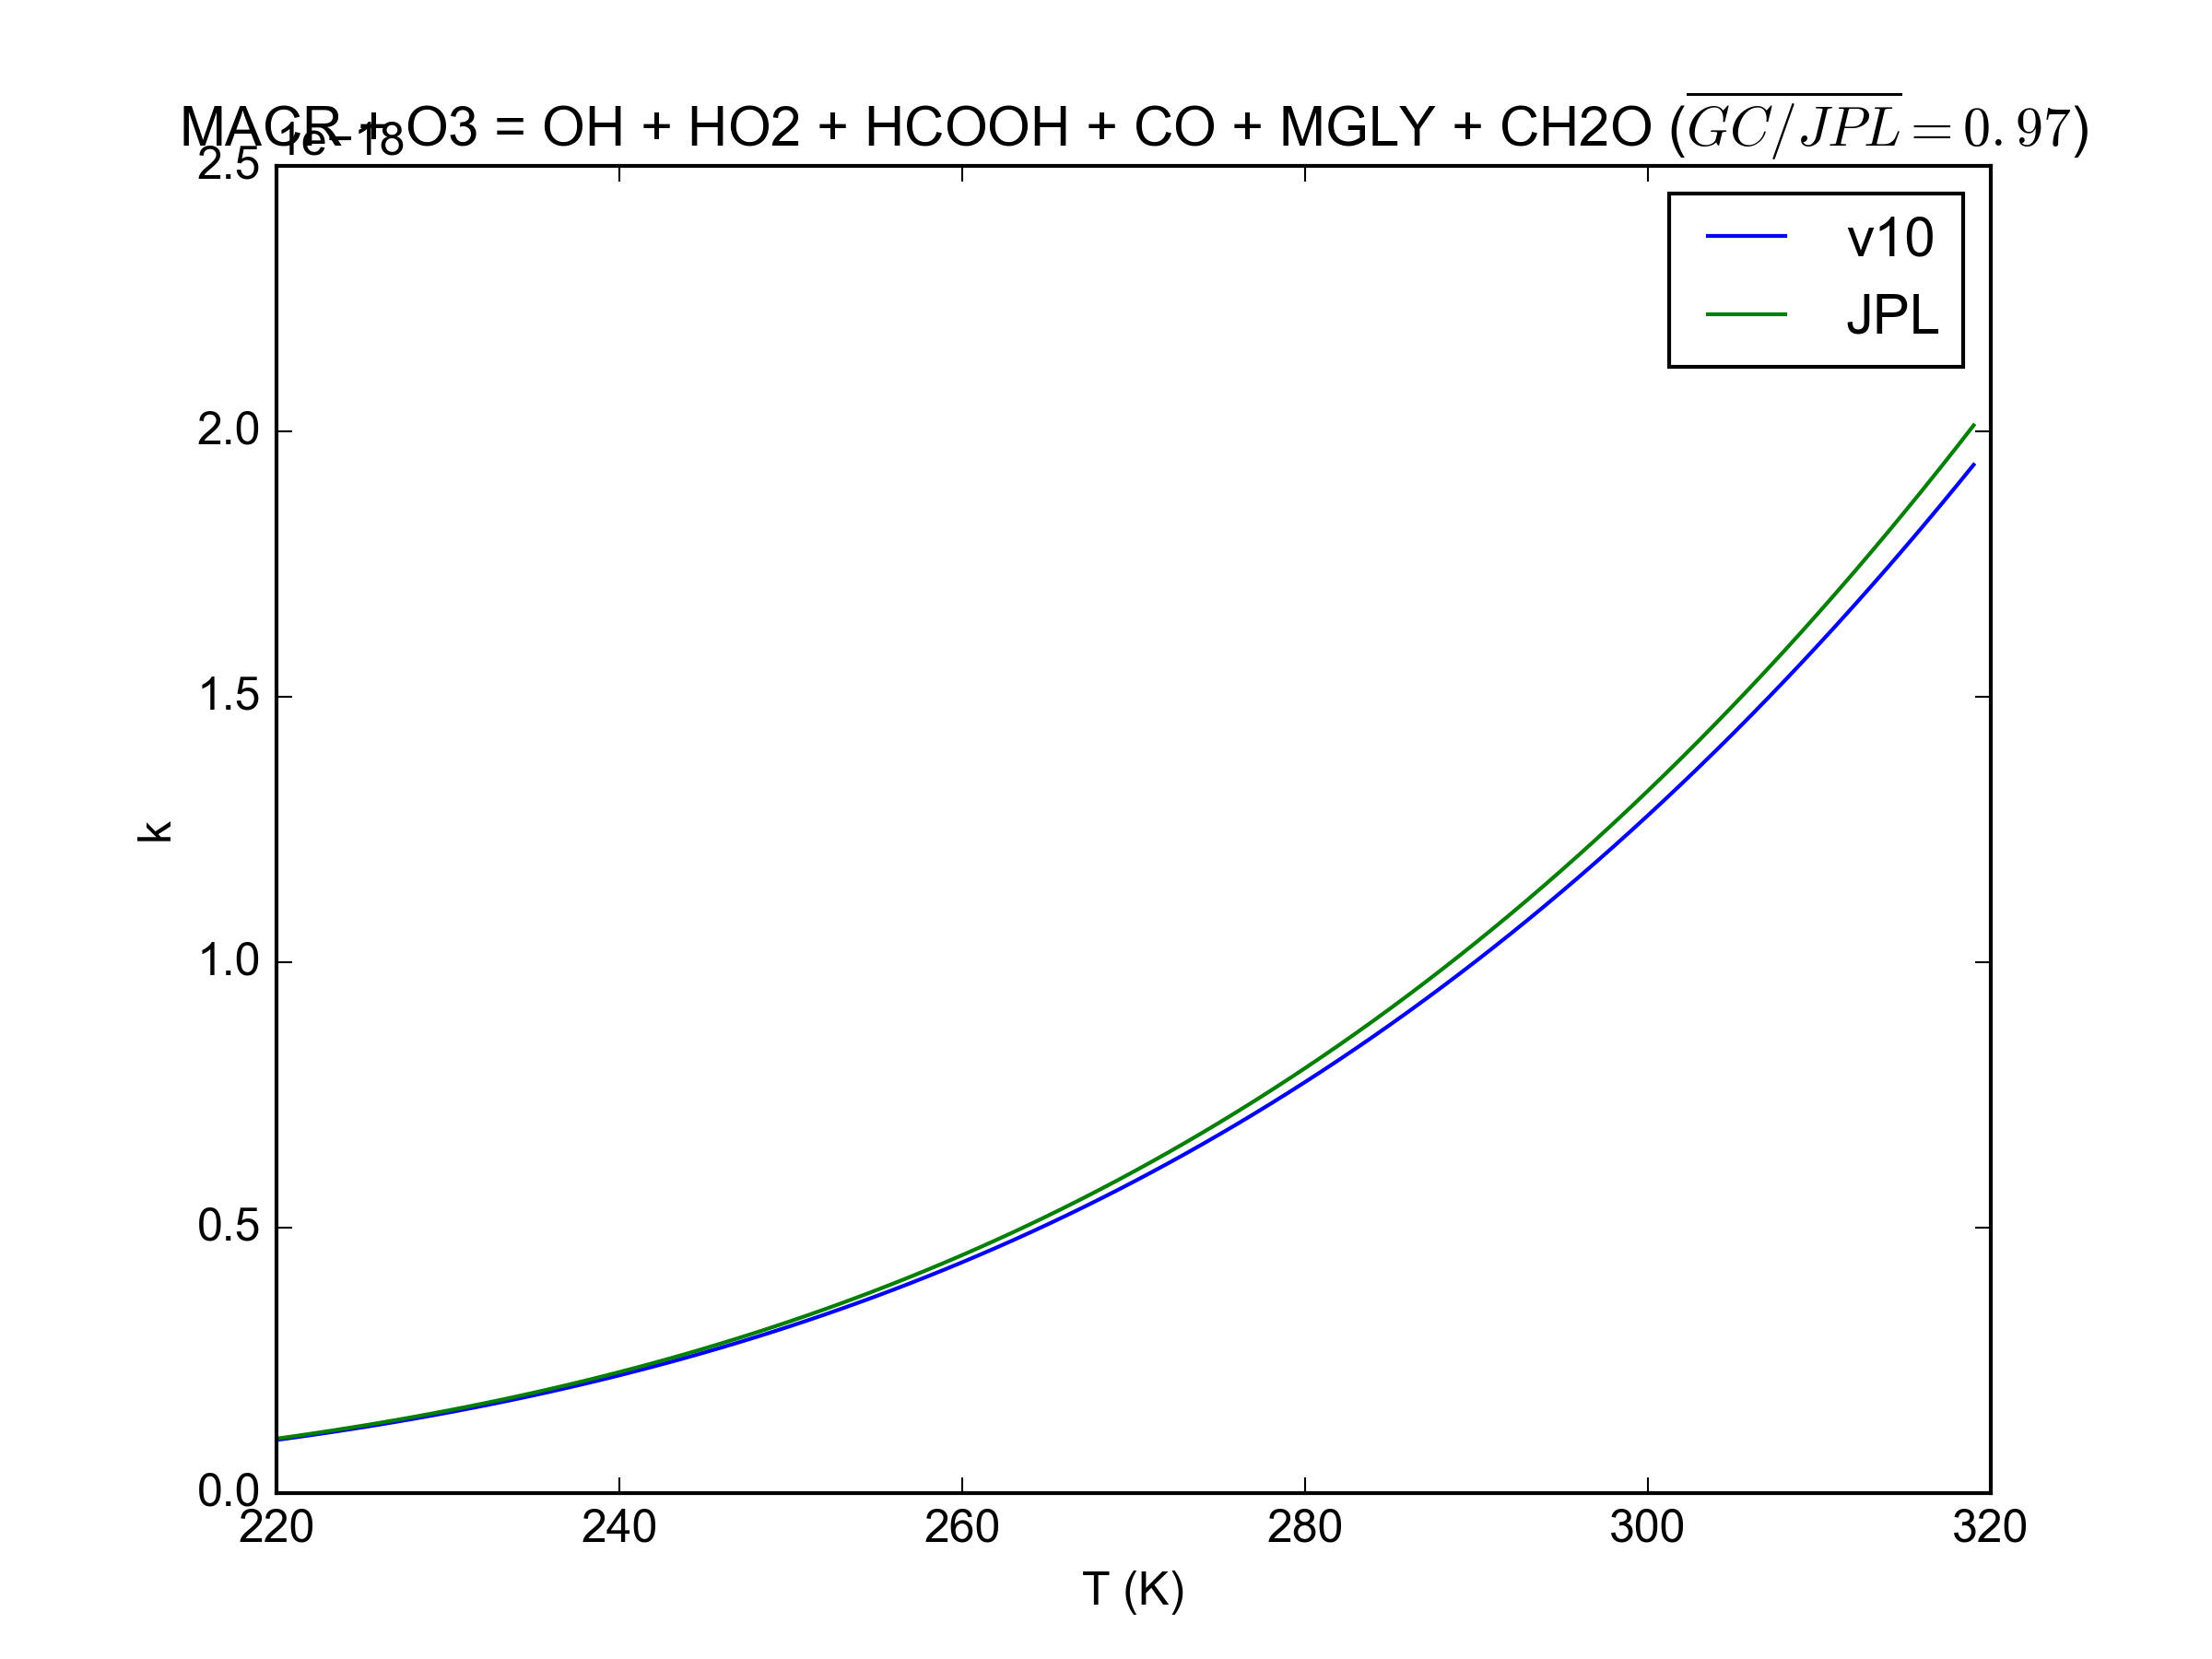
| 20:24, 3 May 2016 | JPL201510andGCv10 MACRplO3 eq OHplHO2plHCOOHplCOplMGLYplCH2O.png (file) |  |
138 KB | Barronh | 1 | |
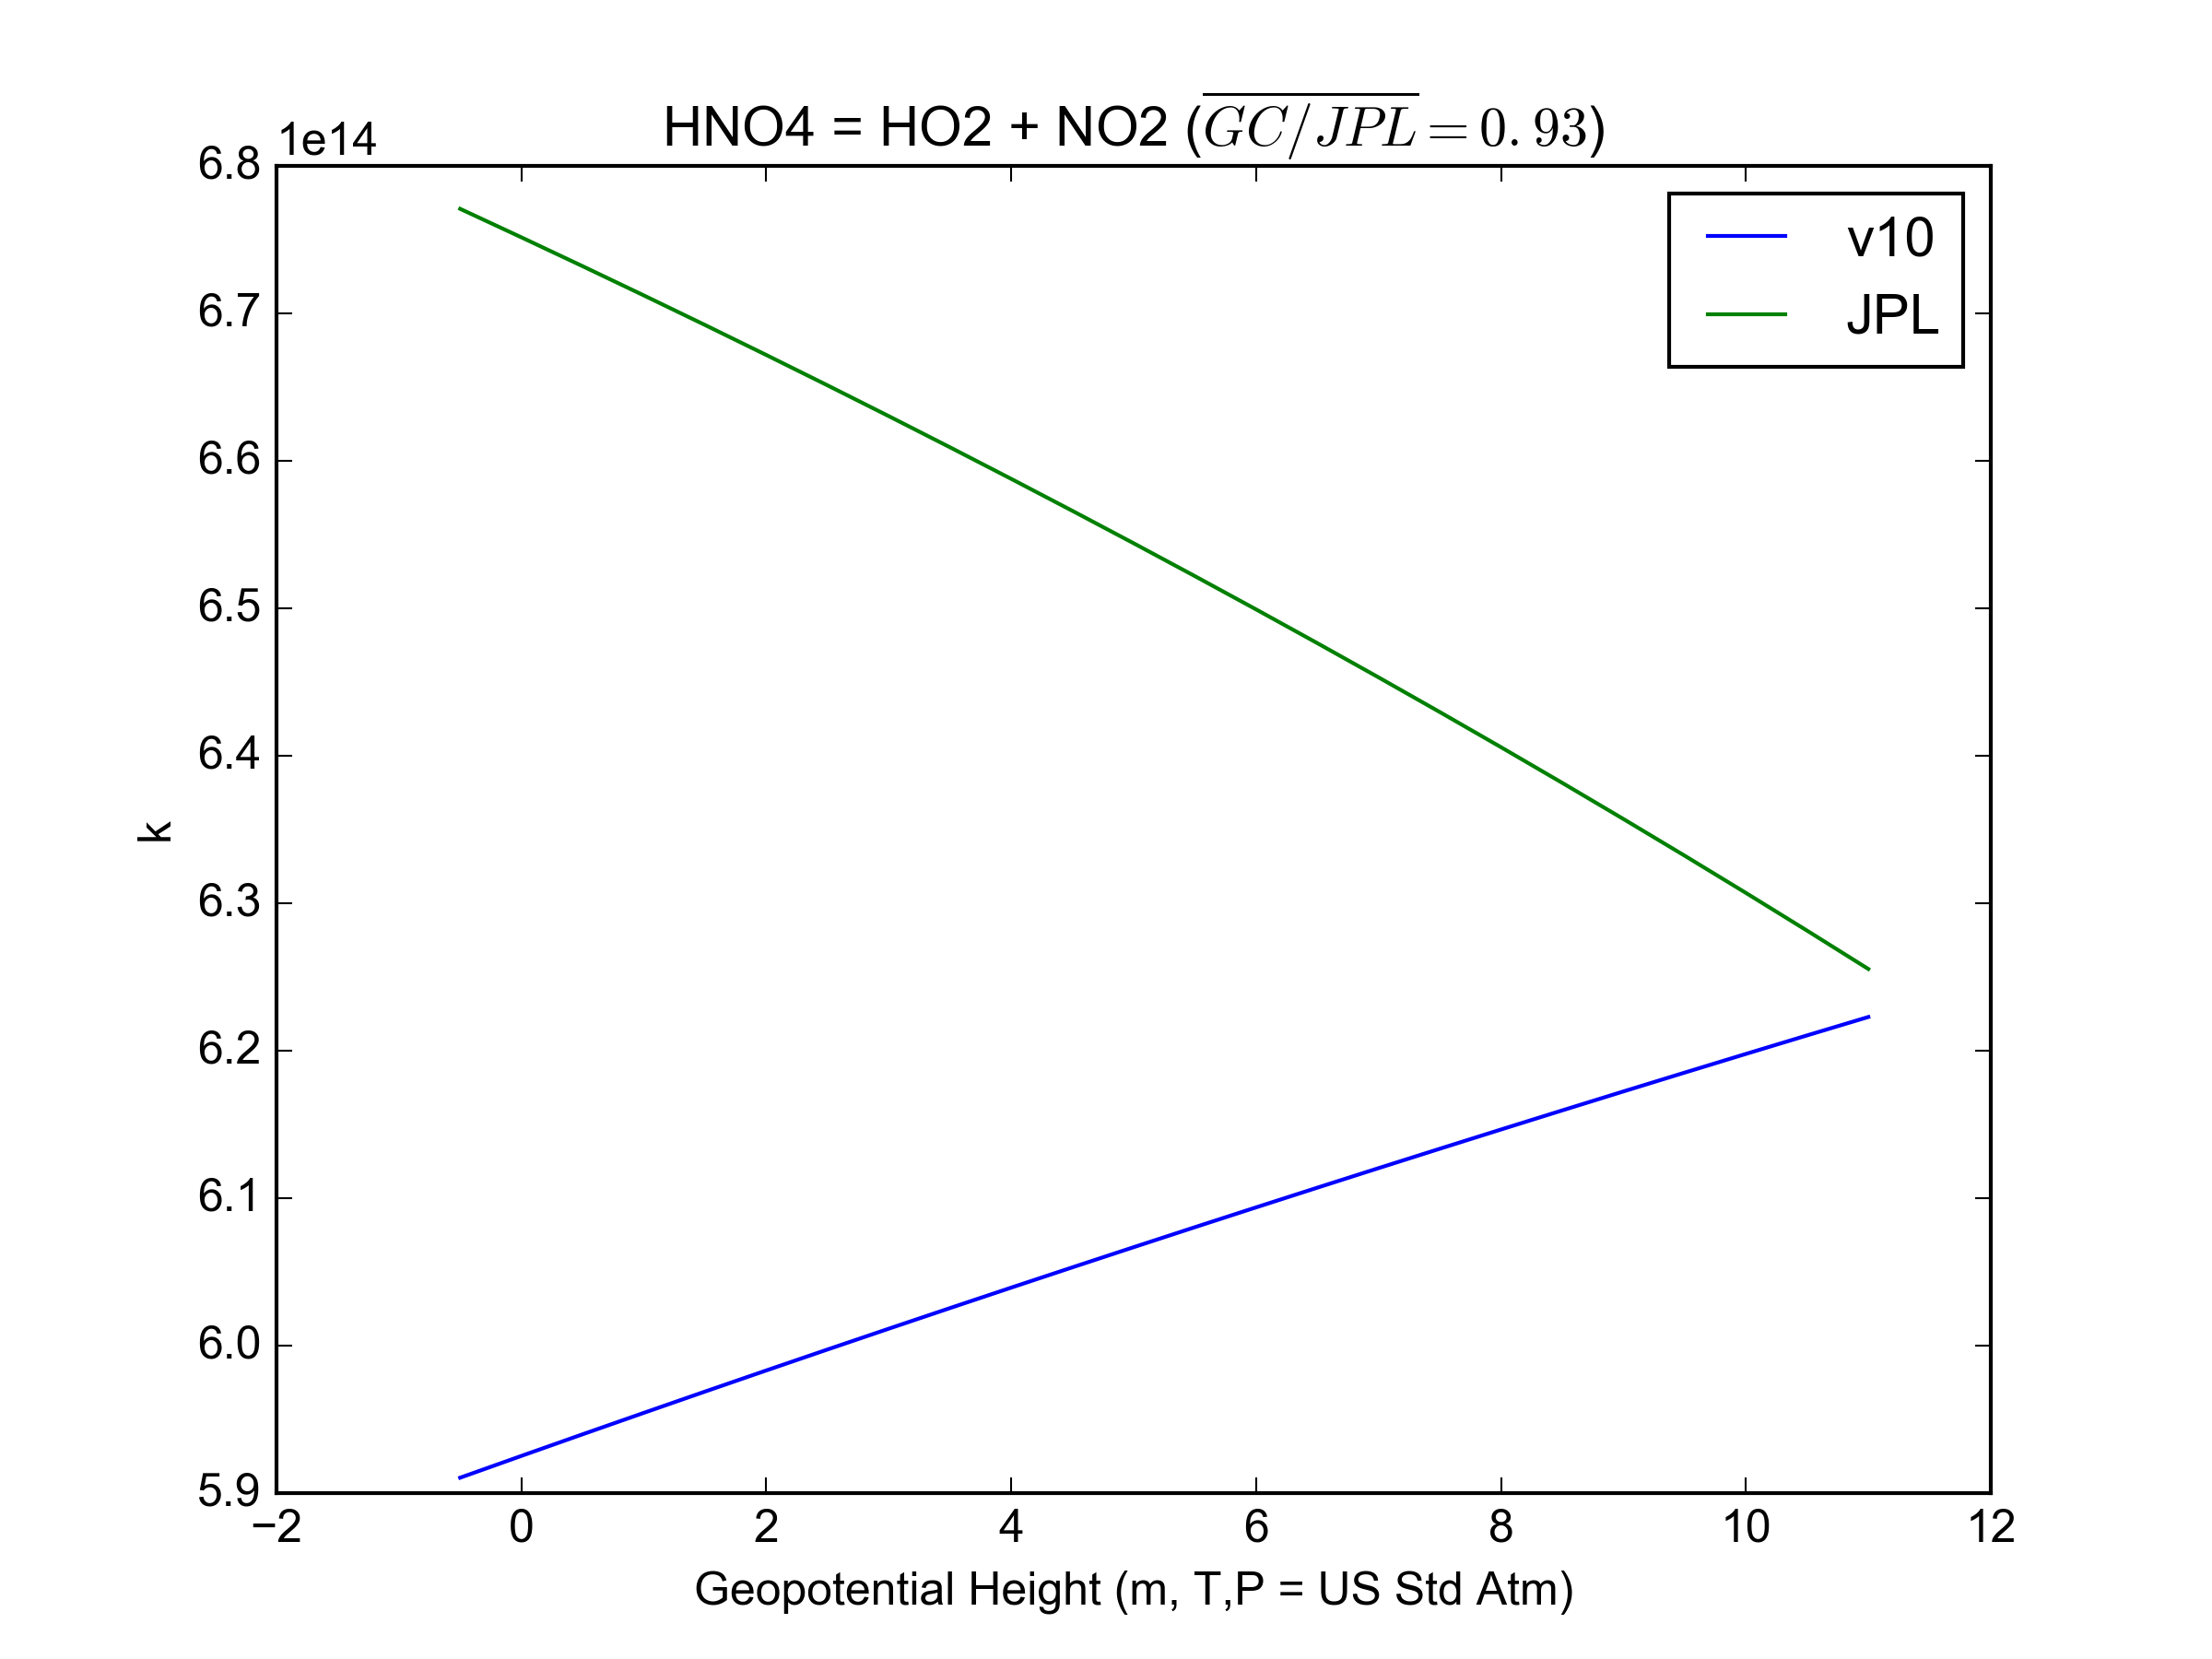
| 20:05, 3 May 2016 | JPL201510andGCv10 HNO4 eq HO2plNO2.png (file) |  |
155 KB | Barronh | GCv10 and JPL 15-10 rate coefficient comparison for HNO4 equilibrium reaction. | 1 |
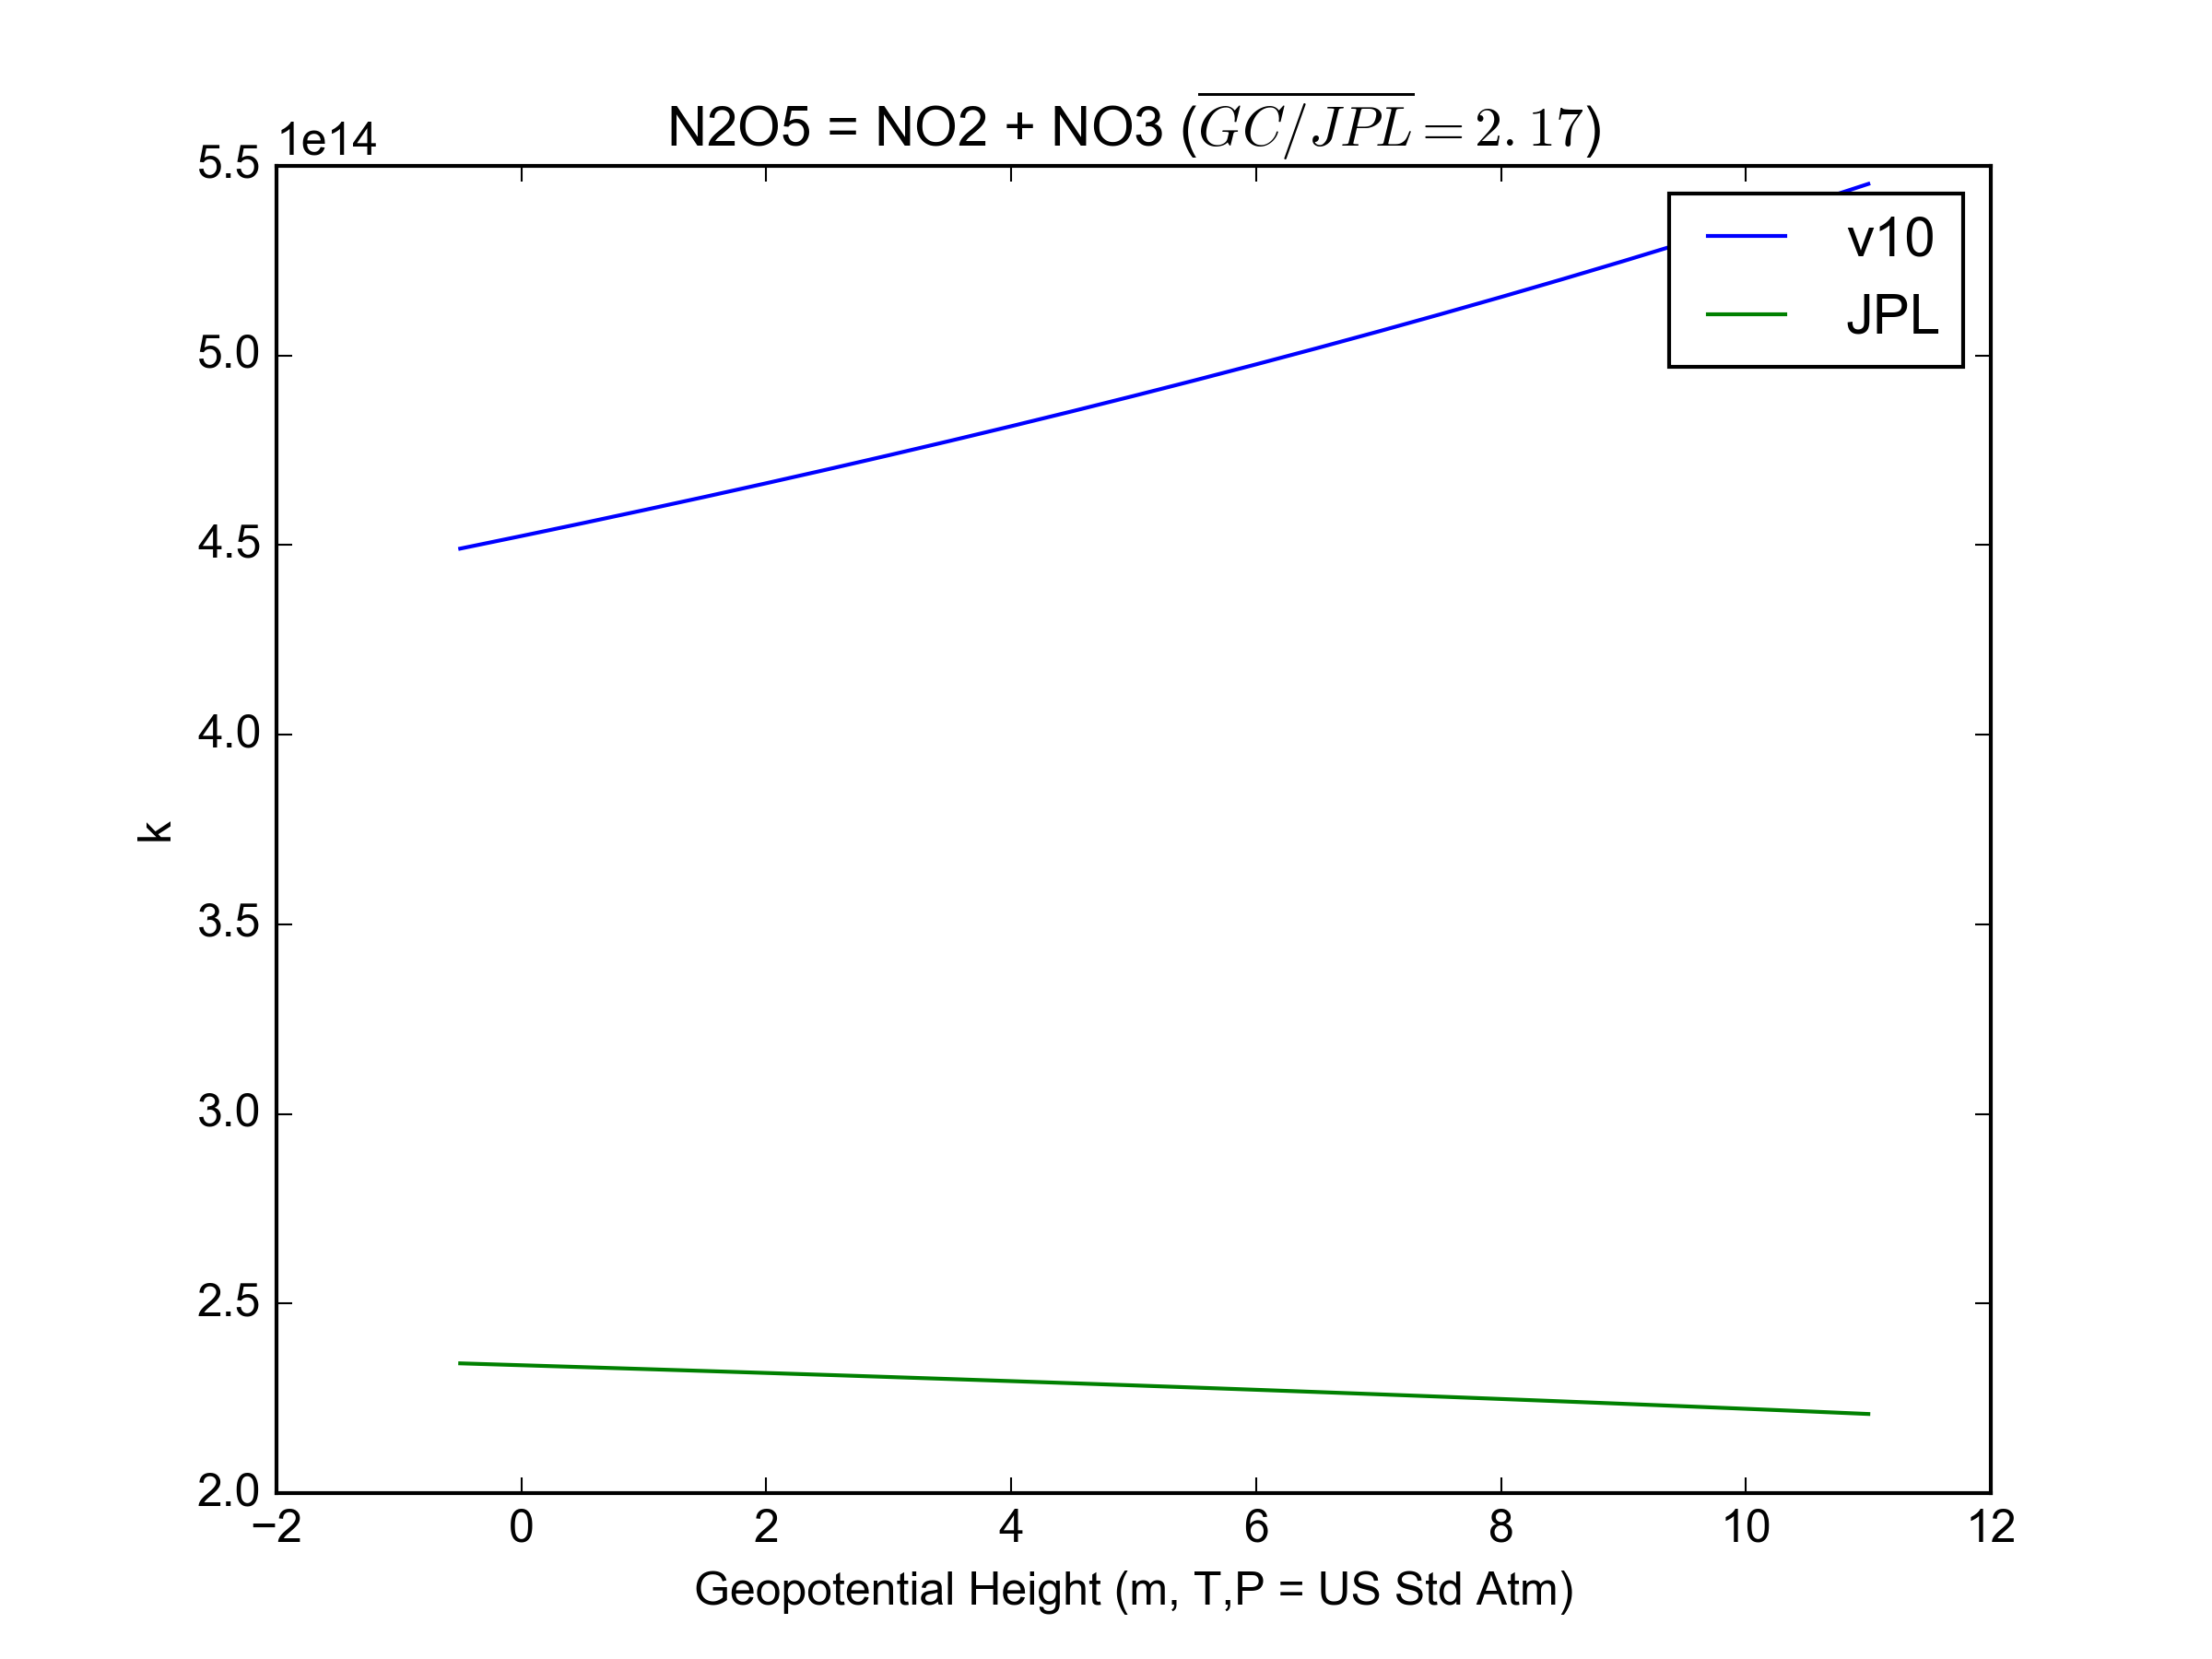
| 20:04, 3 May 2016 | JPL201510andGCv10 N2O5 eq NO2plNO3.png (file) |  |
112 KB | Barronh | GCv10 and JPL 15-10 rate coefficient comparison for N2O5 equilibrium reaction. | 1 |
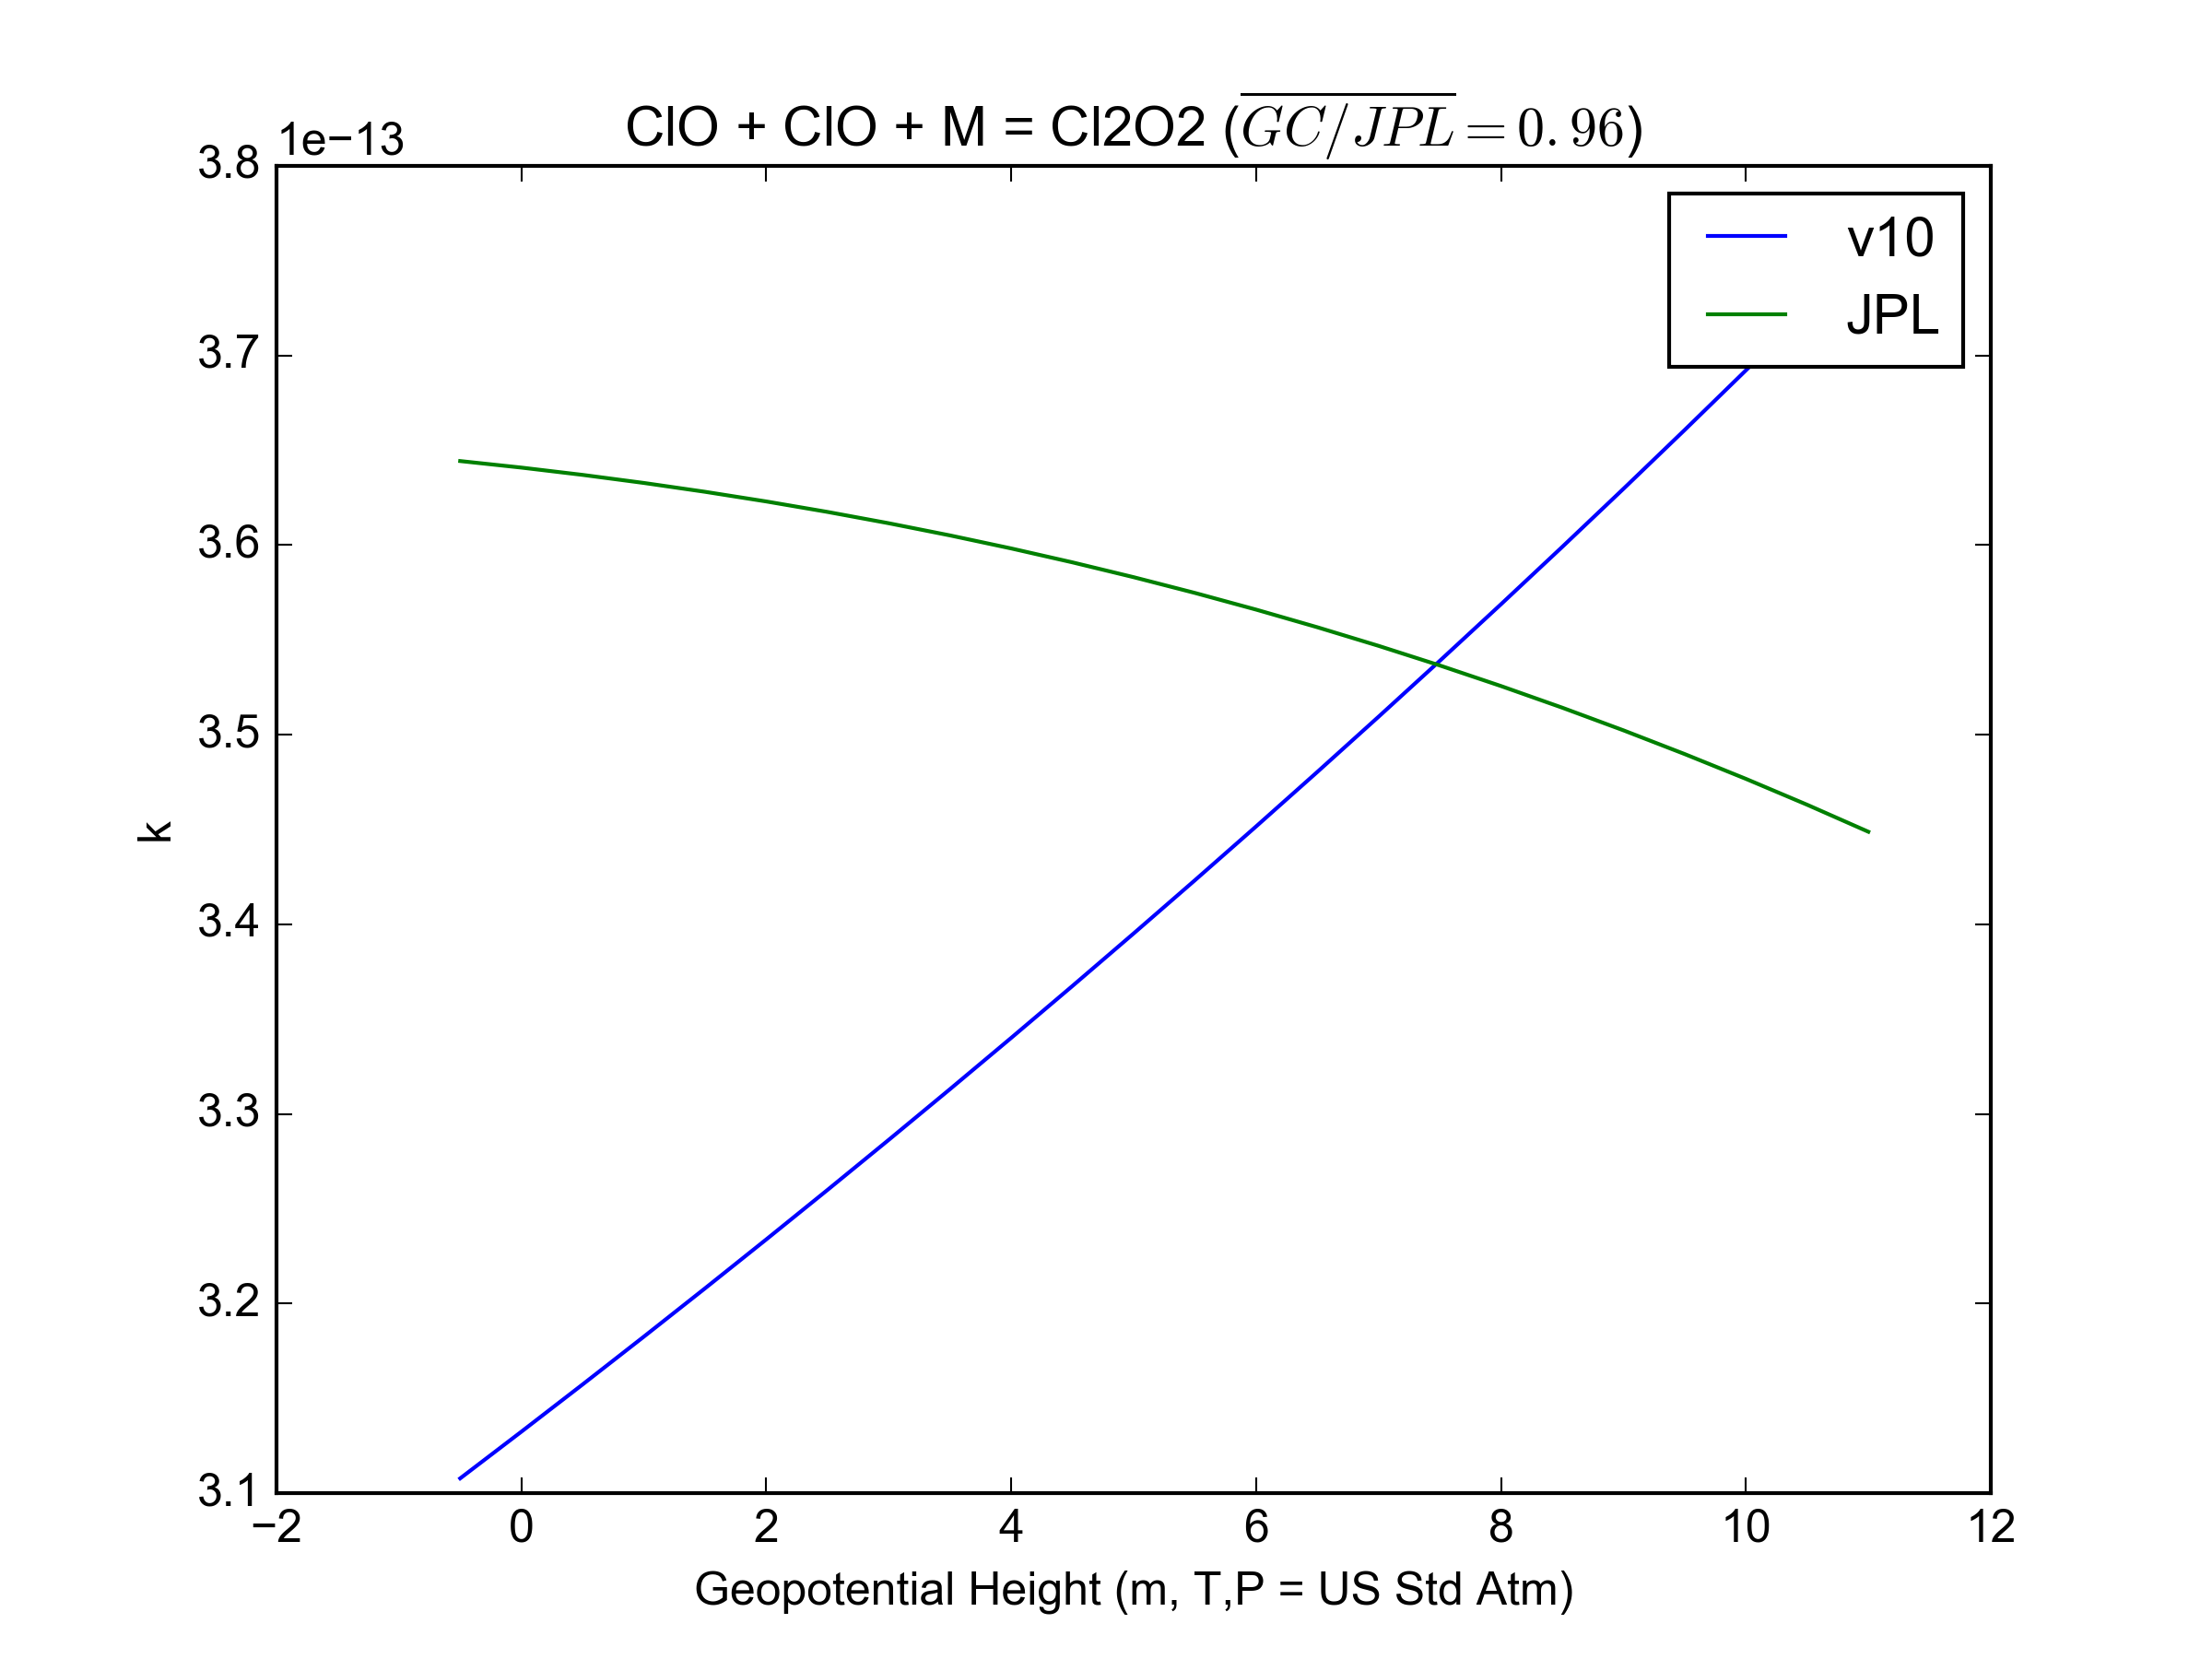
| 20:04, 3 May 2016 | JPL201510andGCv10 ClOplClOplM eq Cl2O2.png (file) |  |
146 KB | Barronh | GCv10 and JPL 15-10 rate coefficient comparison for ClO reacting with ClO | 1 |
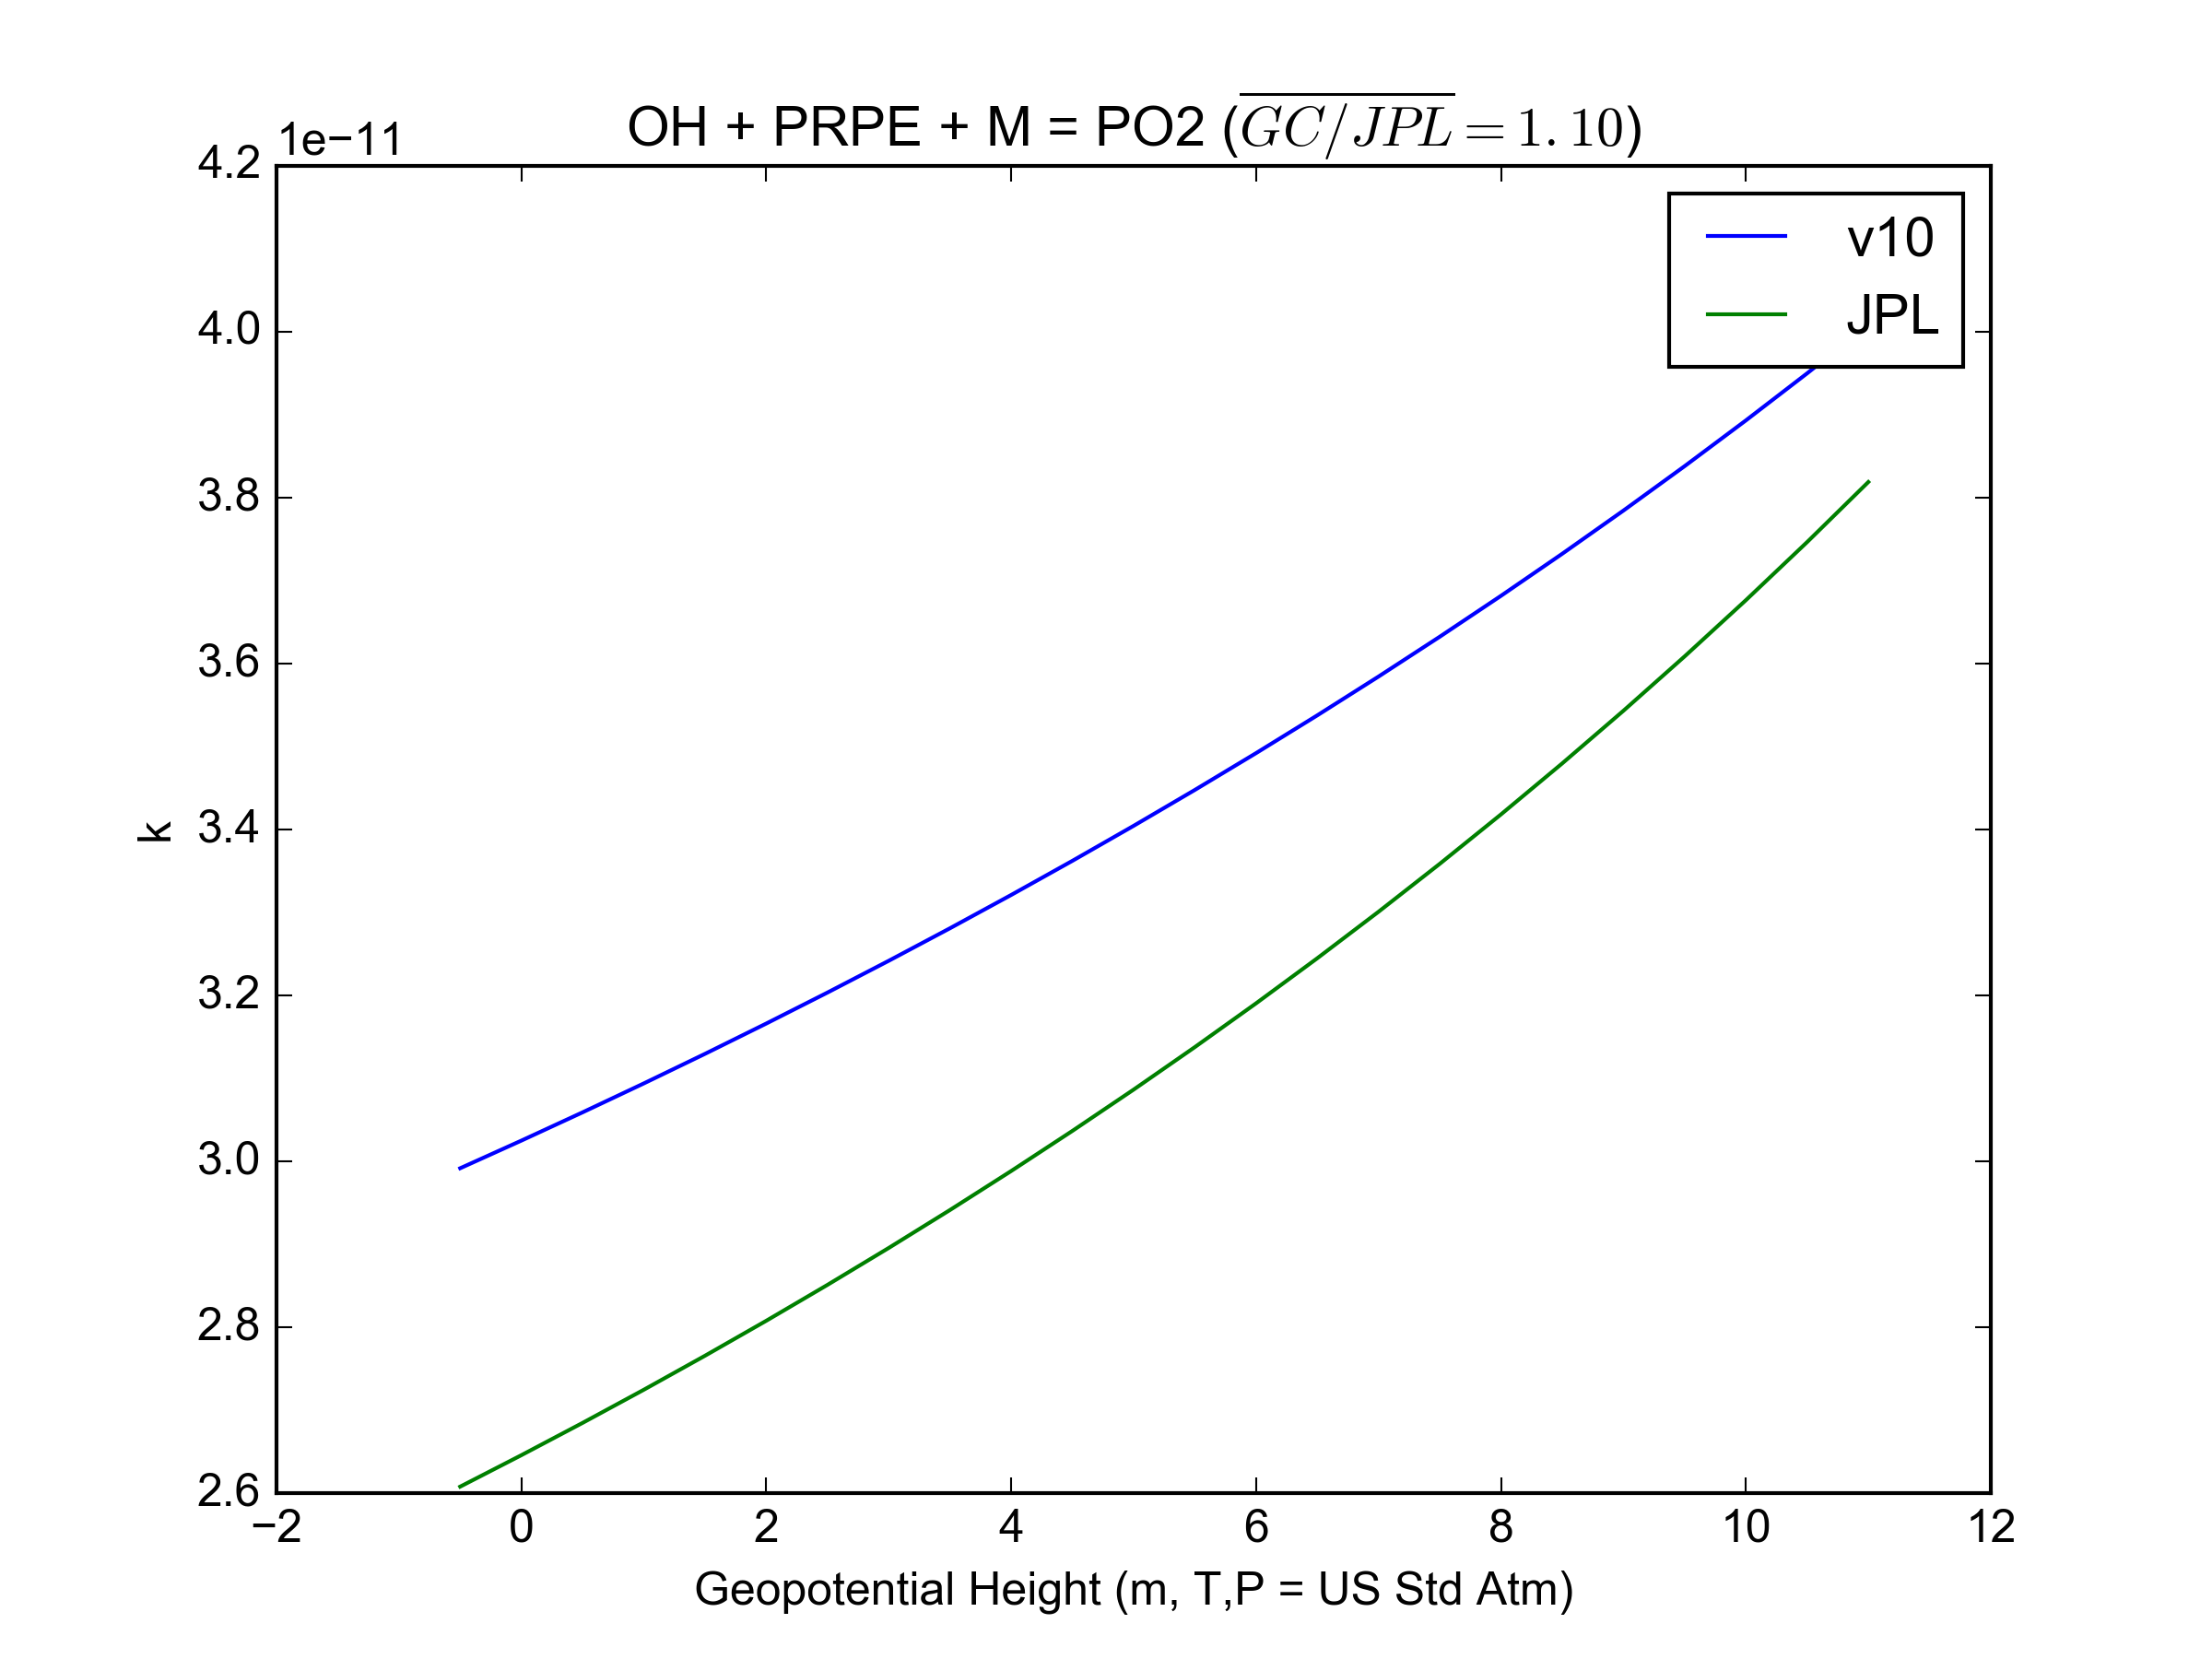
| 20:03, 3 May 2016 | JPL201510andGCv10 OHplPRPEplM eq PO2.png (file) |  |
155 KB | Barronh | GCv10 and JPL 15-10 rate coefficient comparison for propene with hydroxyl radical | 1 |
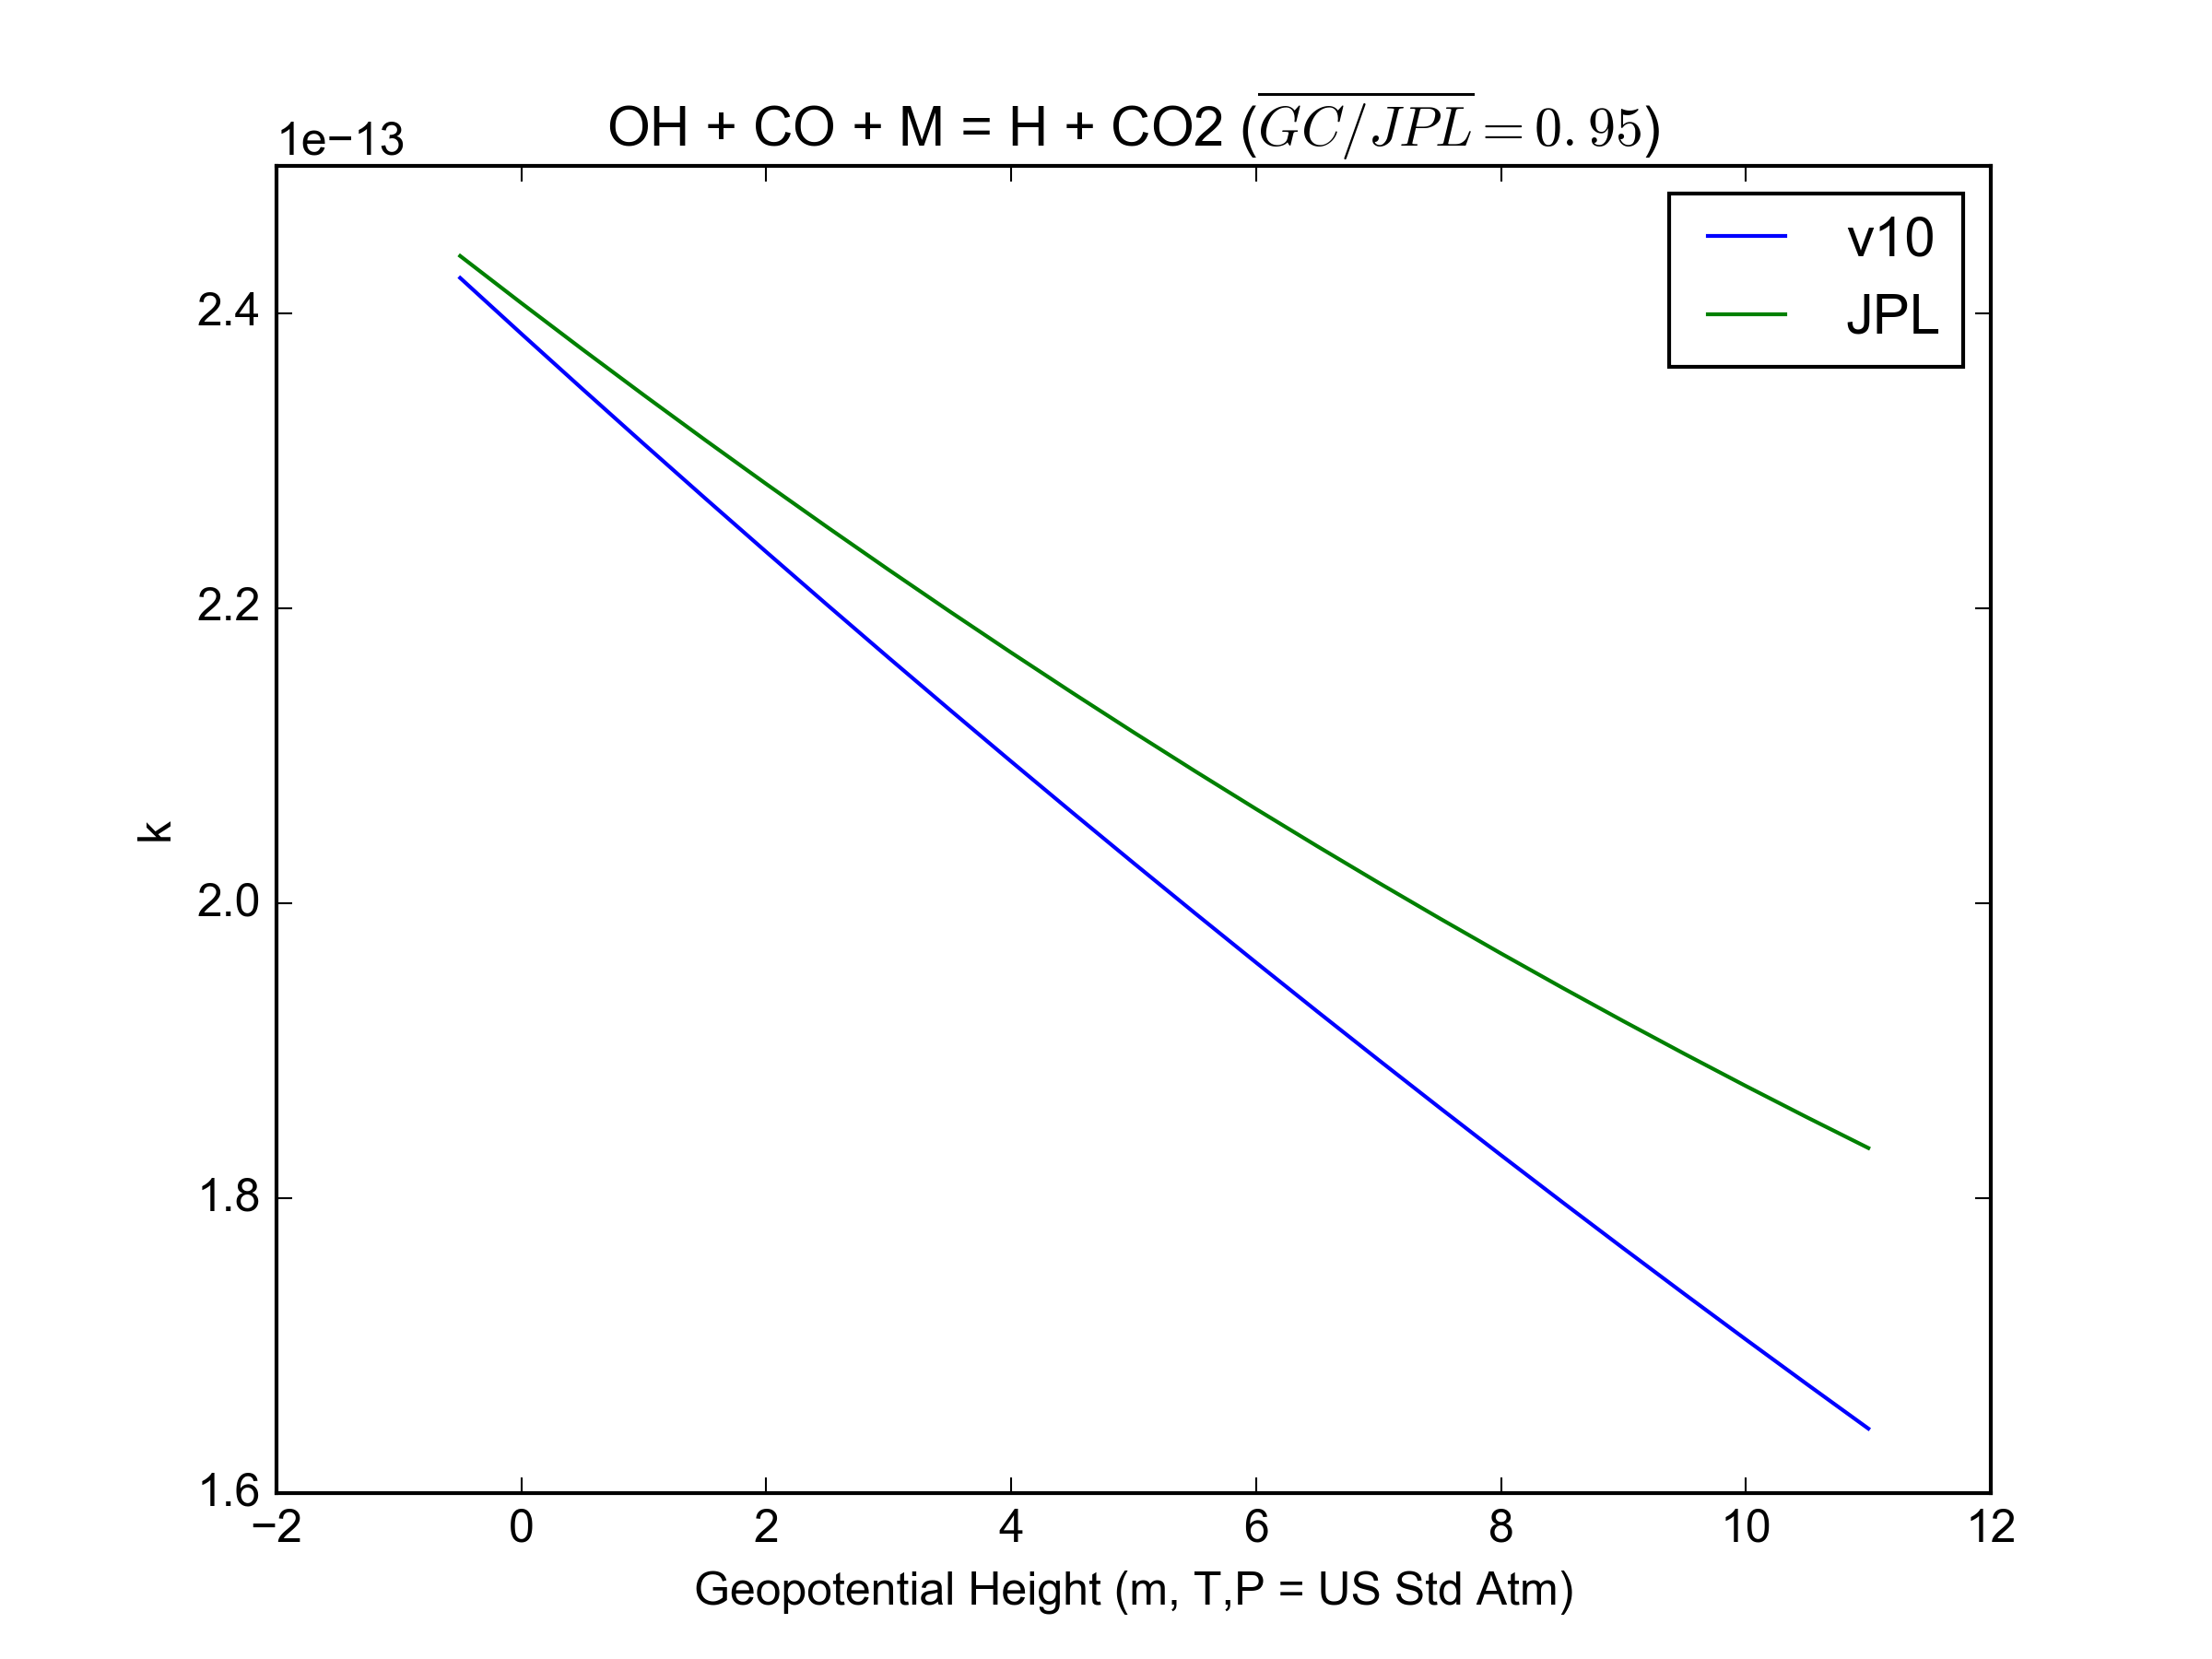
| 20:02, 3 May 2016 | JPL201510andGCv10 OHplCOplM eq HplCO2.png (file) |  |
154 KB | Barronh | 1 | |
| 20:01, 3 May 2016 | JPL201510andGCv10 NO2plNO3plM eq N2O5.png (file) |  |
144 KB | Barronh | 1 | |
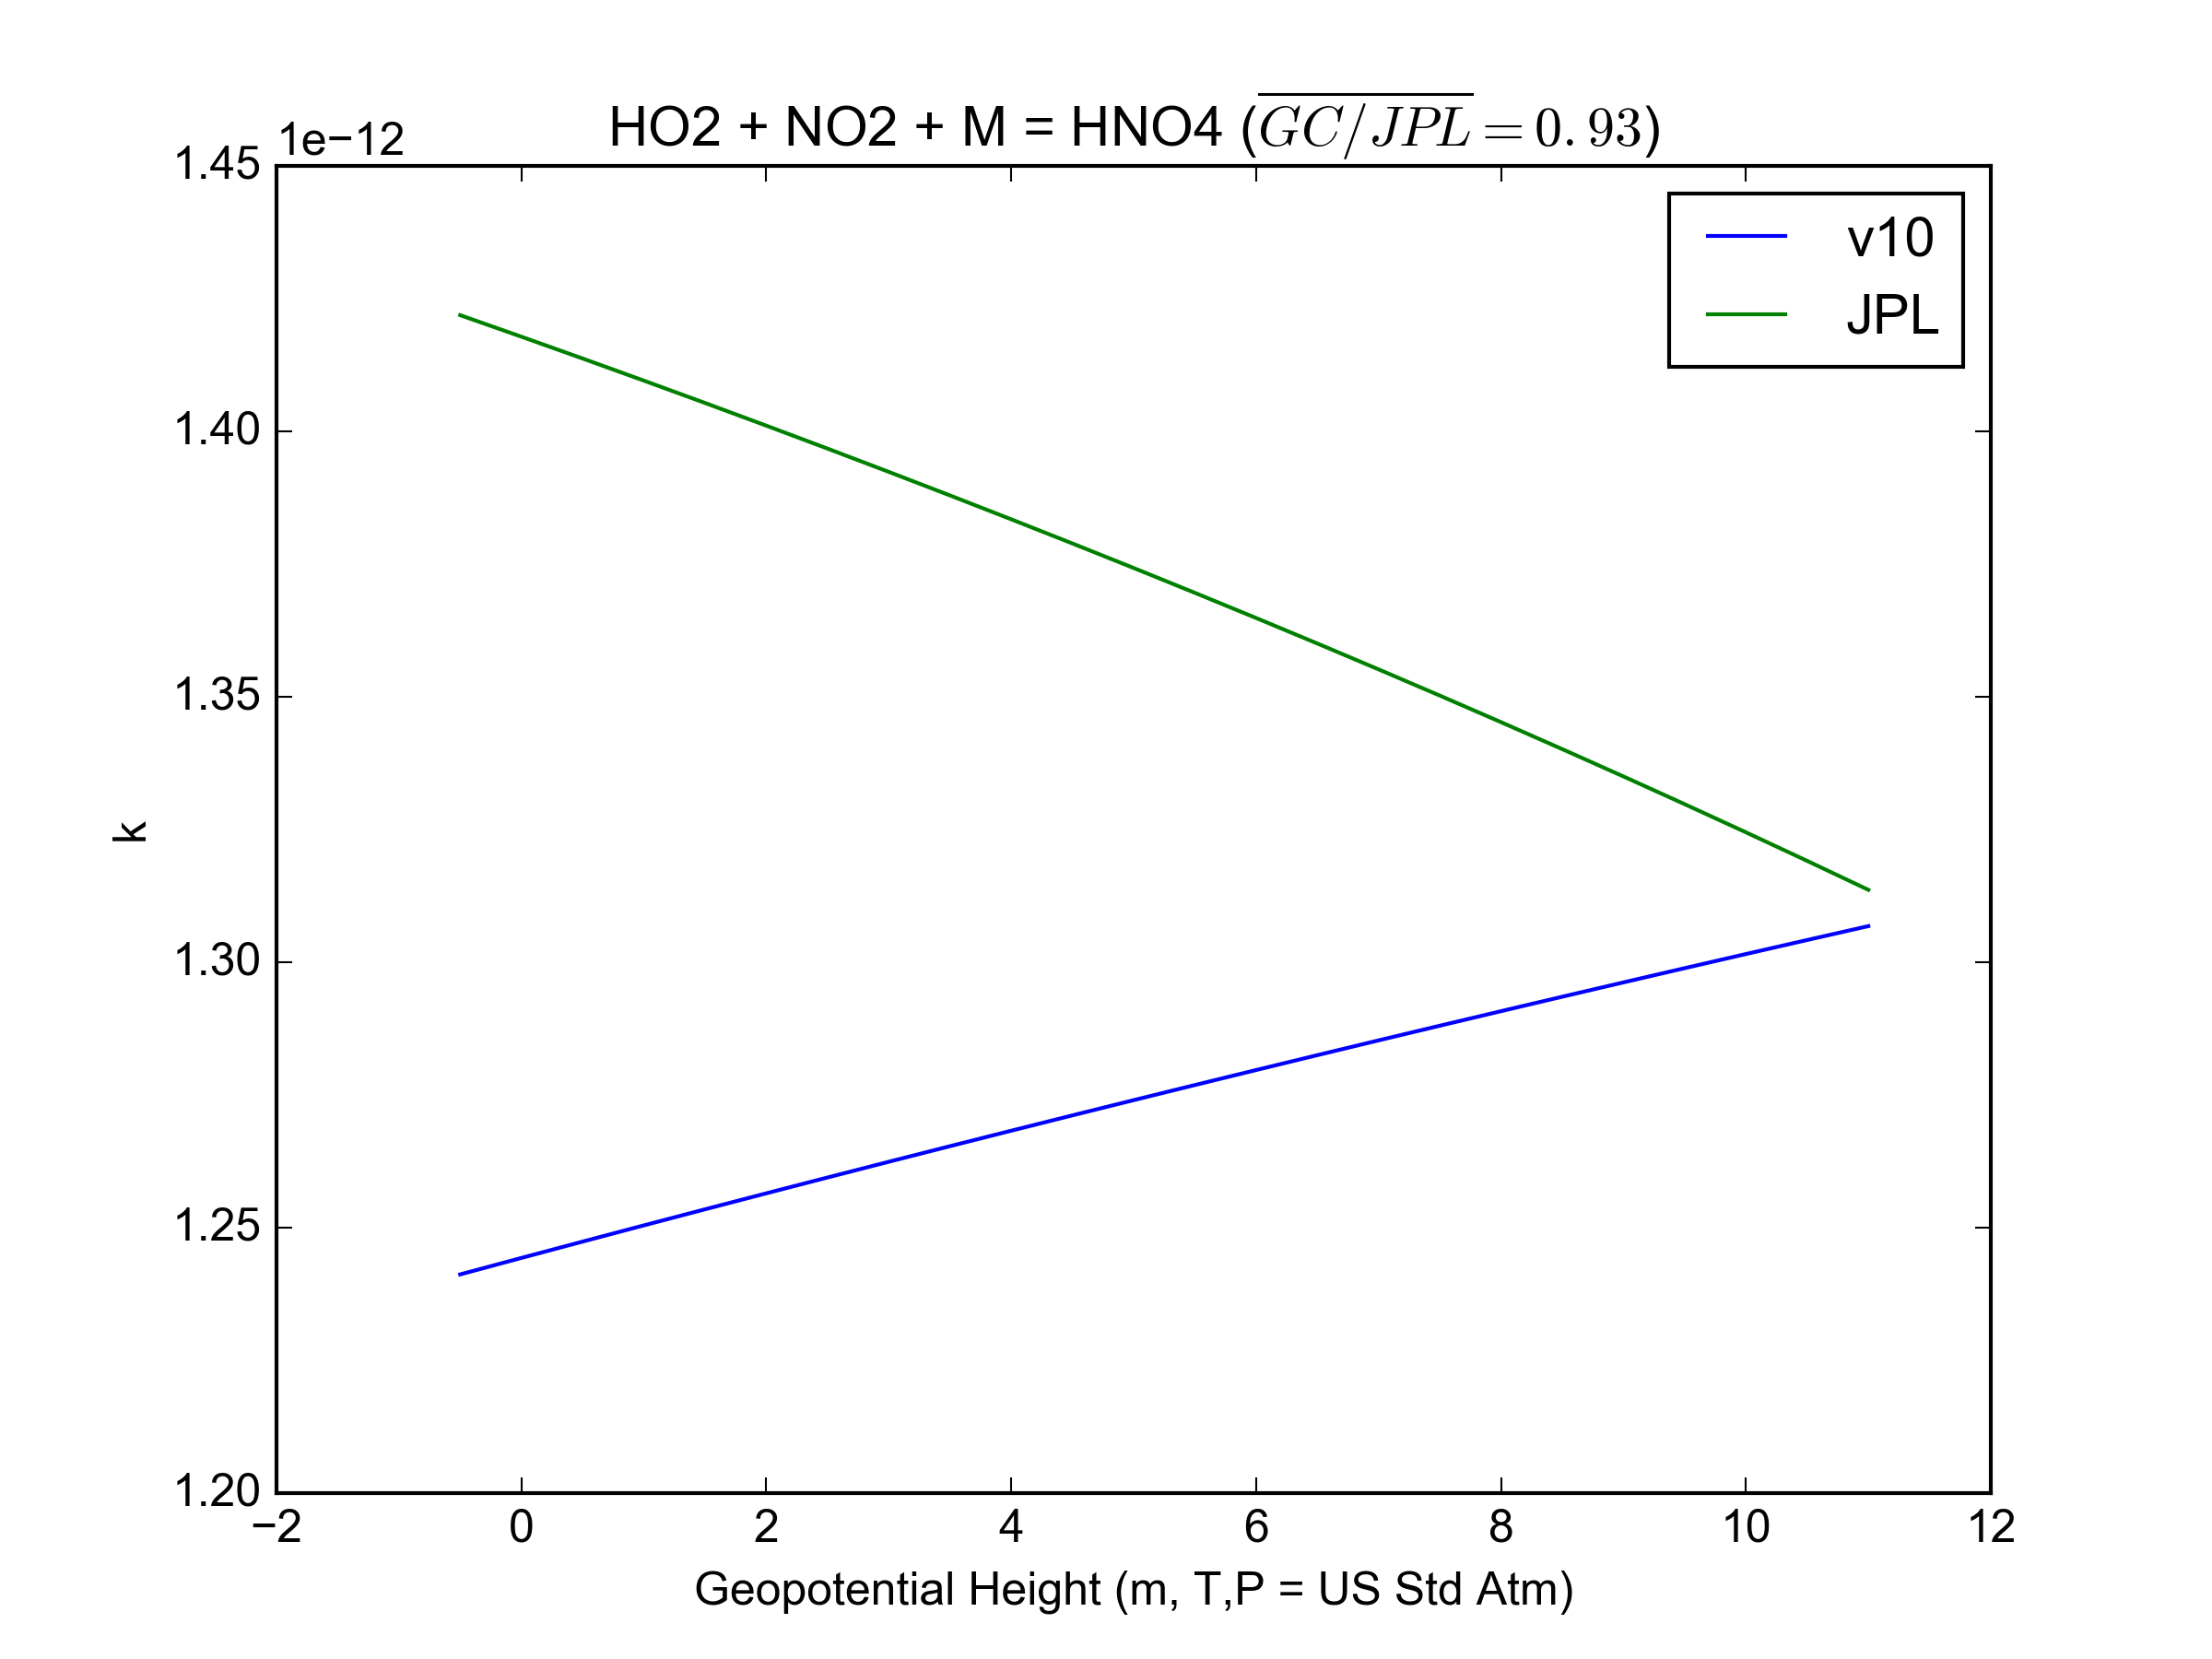
| 20:01, 3 May 2016 | JPL201510andGCv10 HO2plNO2plM eq HNO4.png (file) |  |
136 KB | Barronh | 1 | |
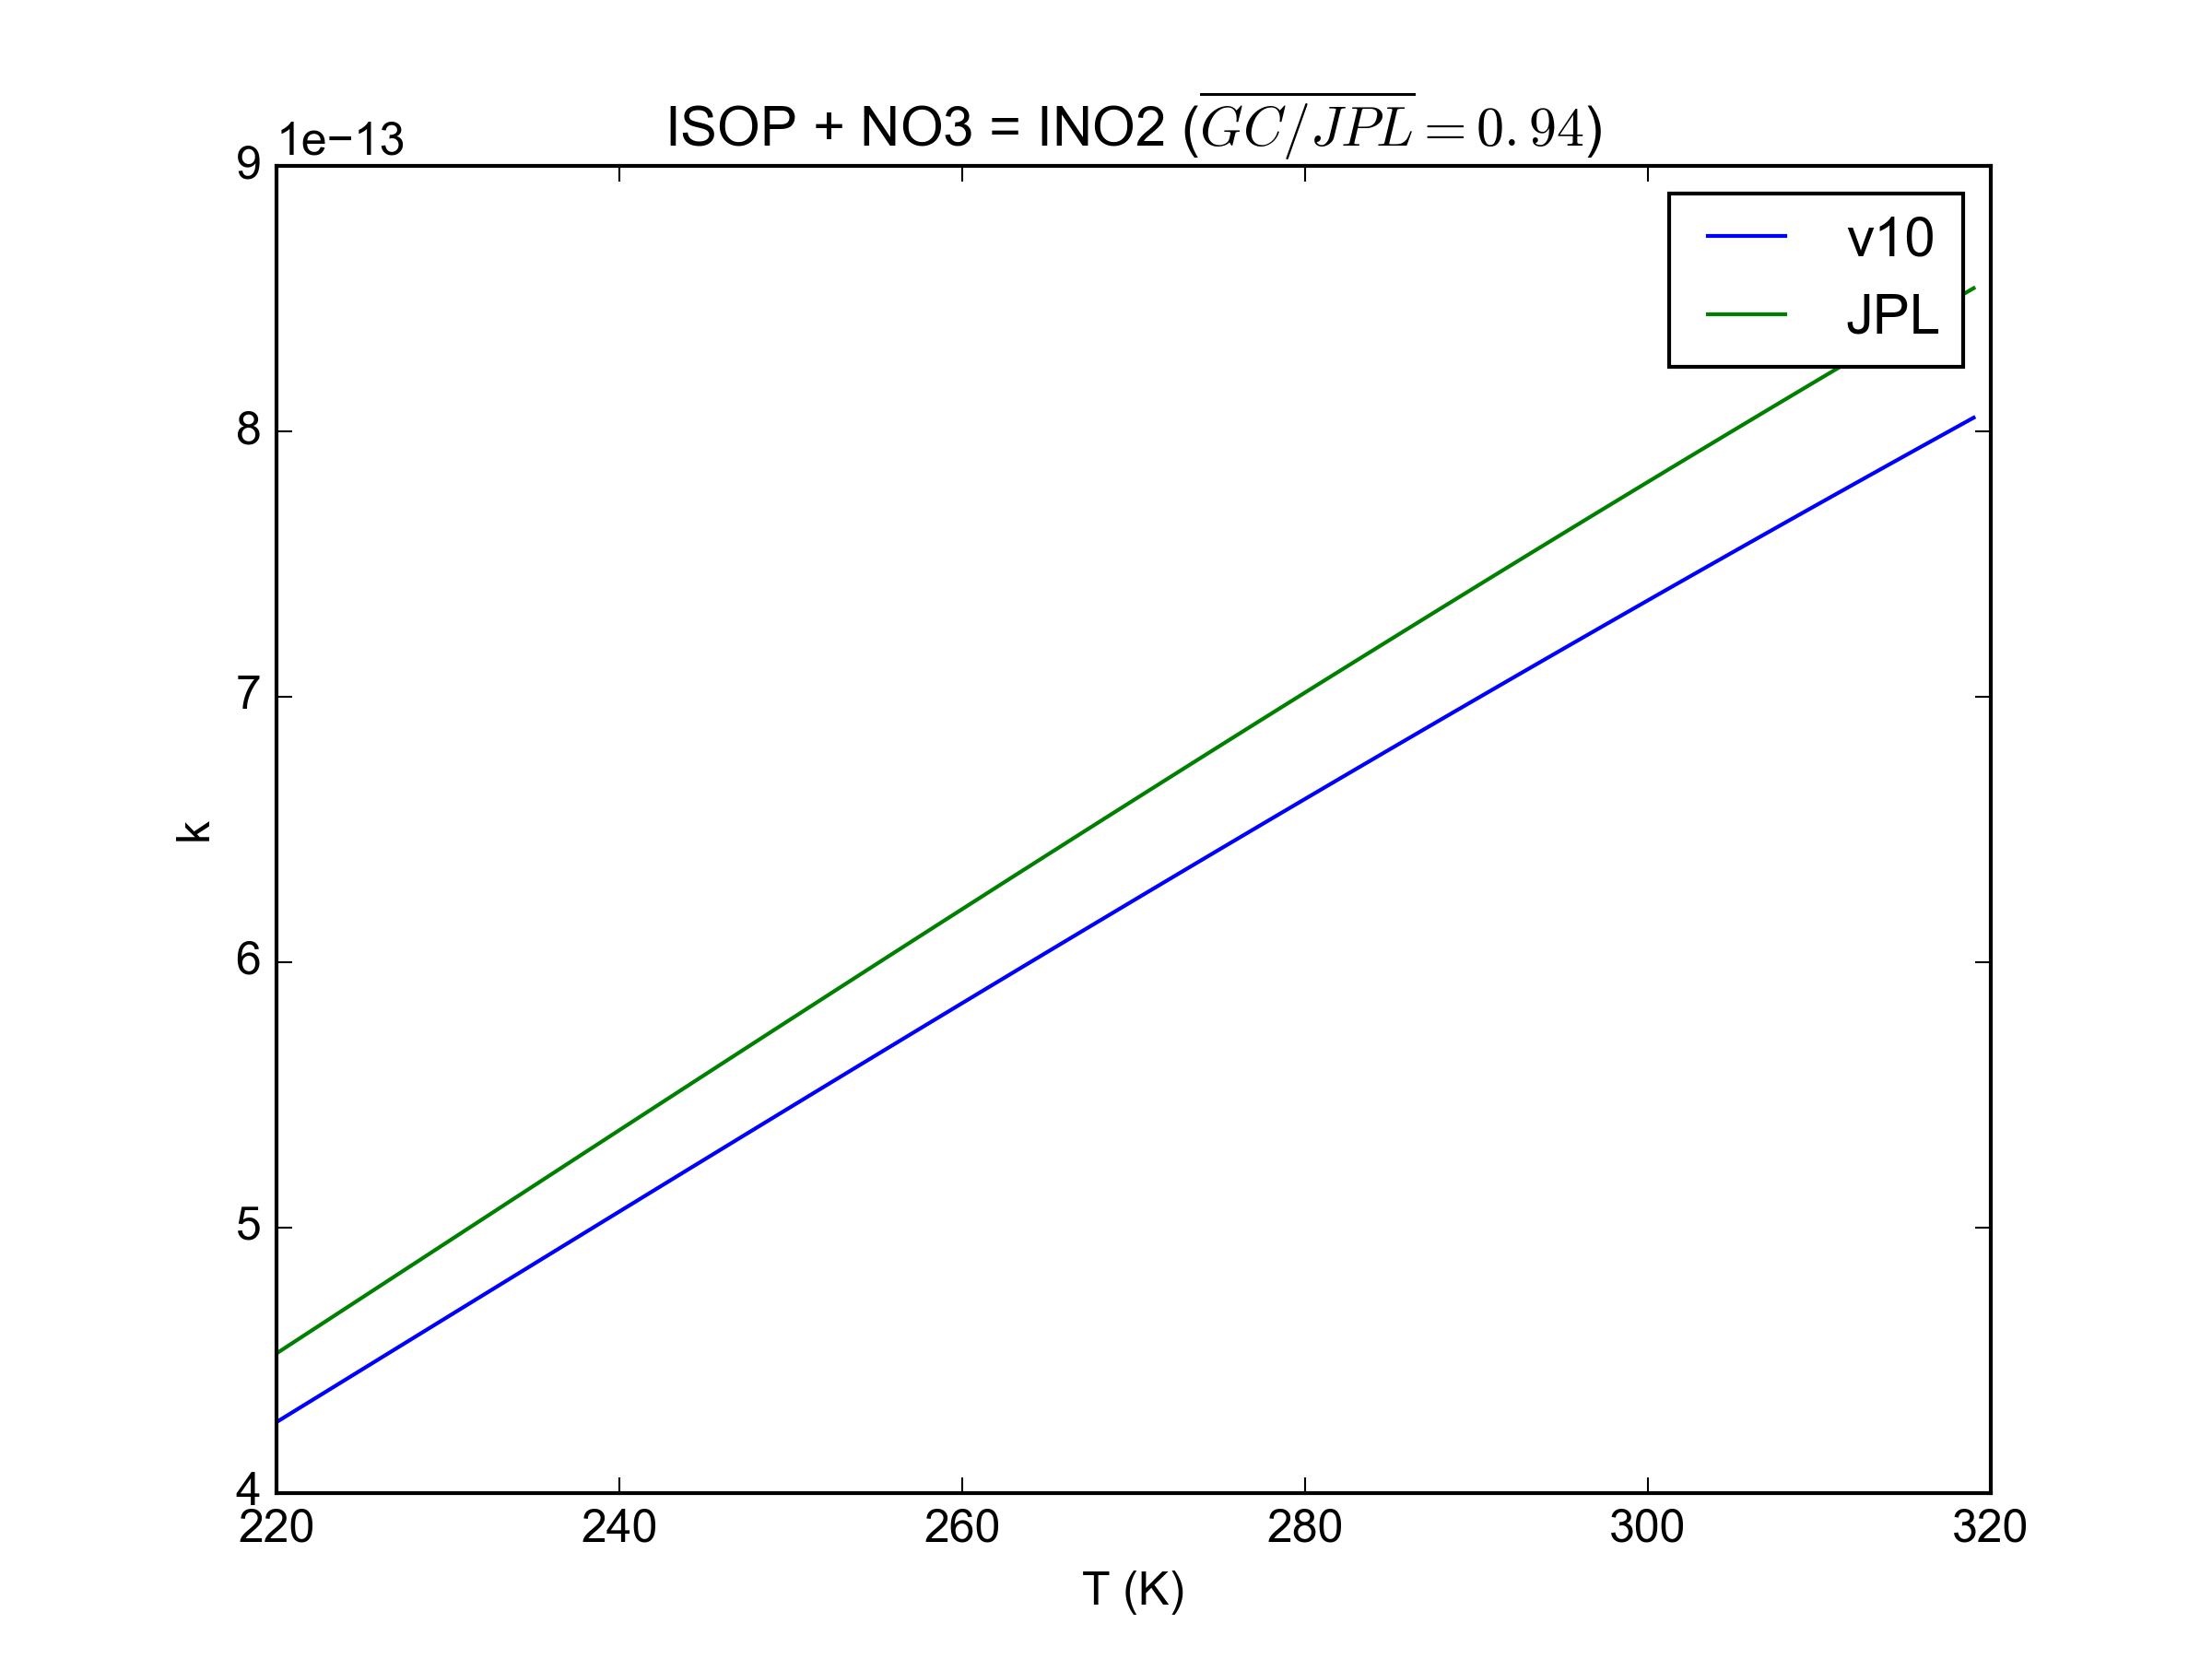
| 19:59, 3 May 2016 | JPL201510andGCv10 ISOPplNO3 eq INO2.png (file) |  |
134 KB | Barronh | GCv10 and JPL 15-10 rate coefficient comparison for isoprene with nitrate radical | 1 |
| 19:58, 3 May 2016 | JPL201510andGCv10 MACRplNO3 eq MAN2.png (file) |  |
88 KB | Barronh | GCv10 and JPL 15-10 rate coefficient comparison for methacrolein with nitrate radical | 1 |
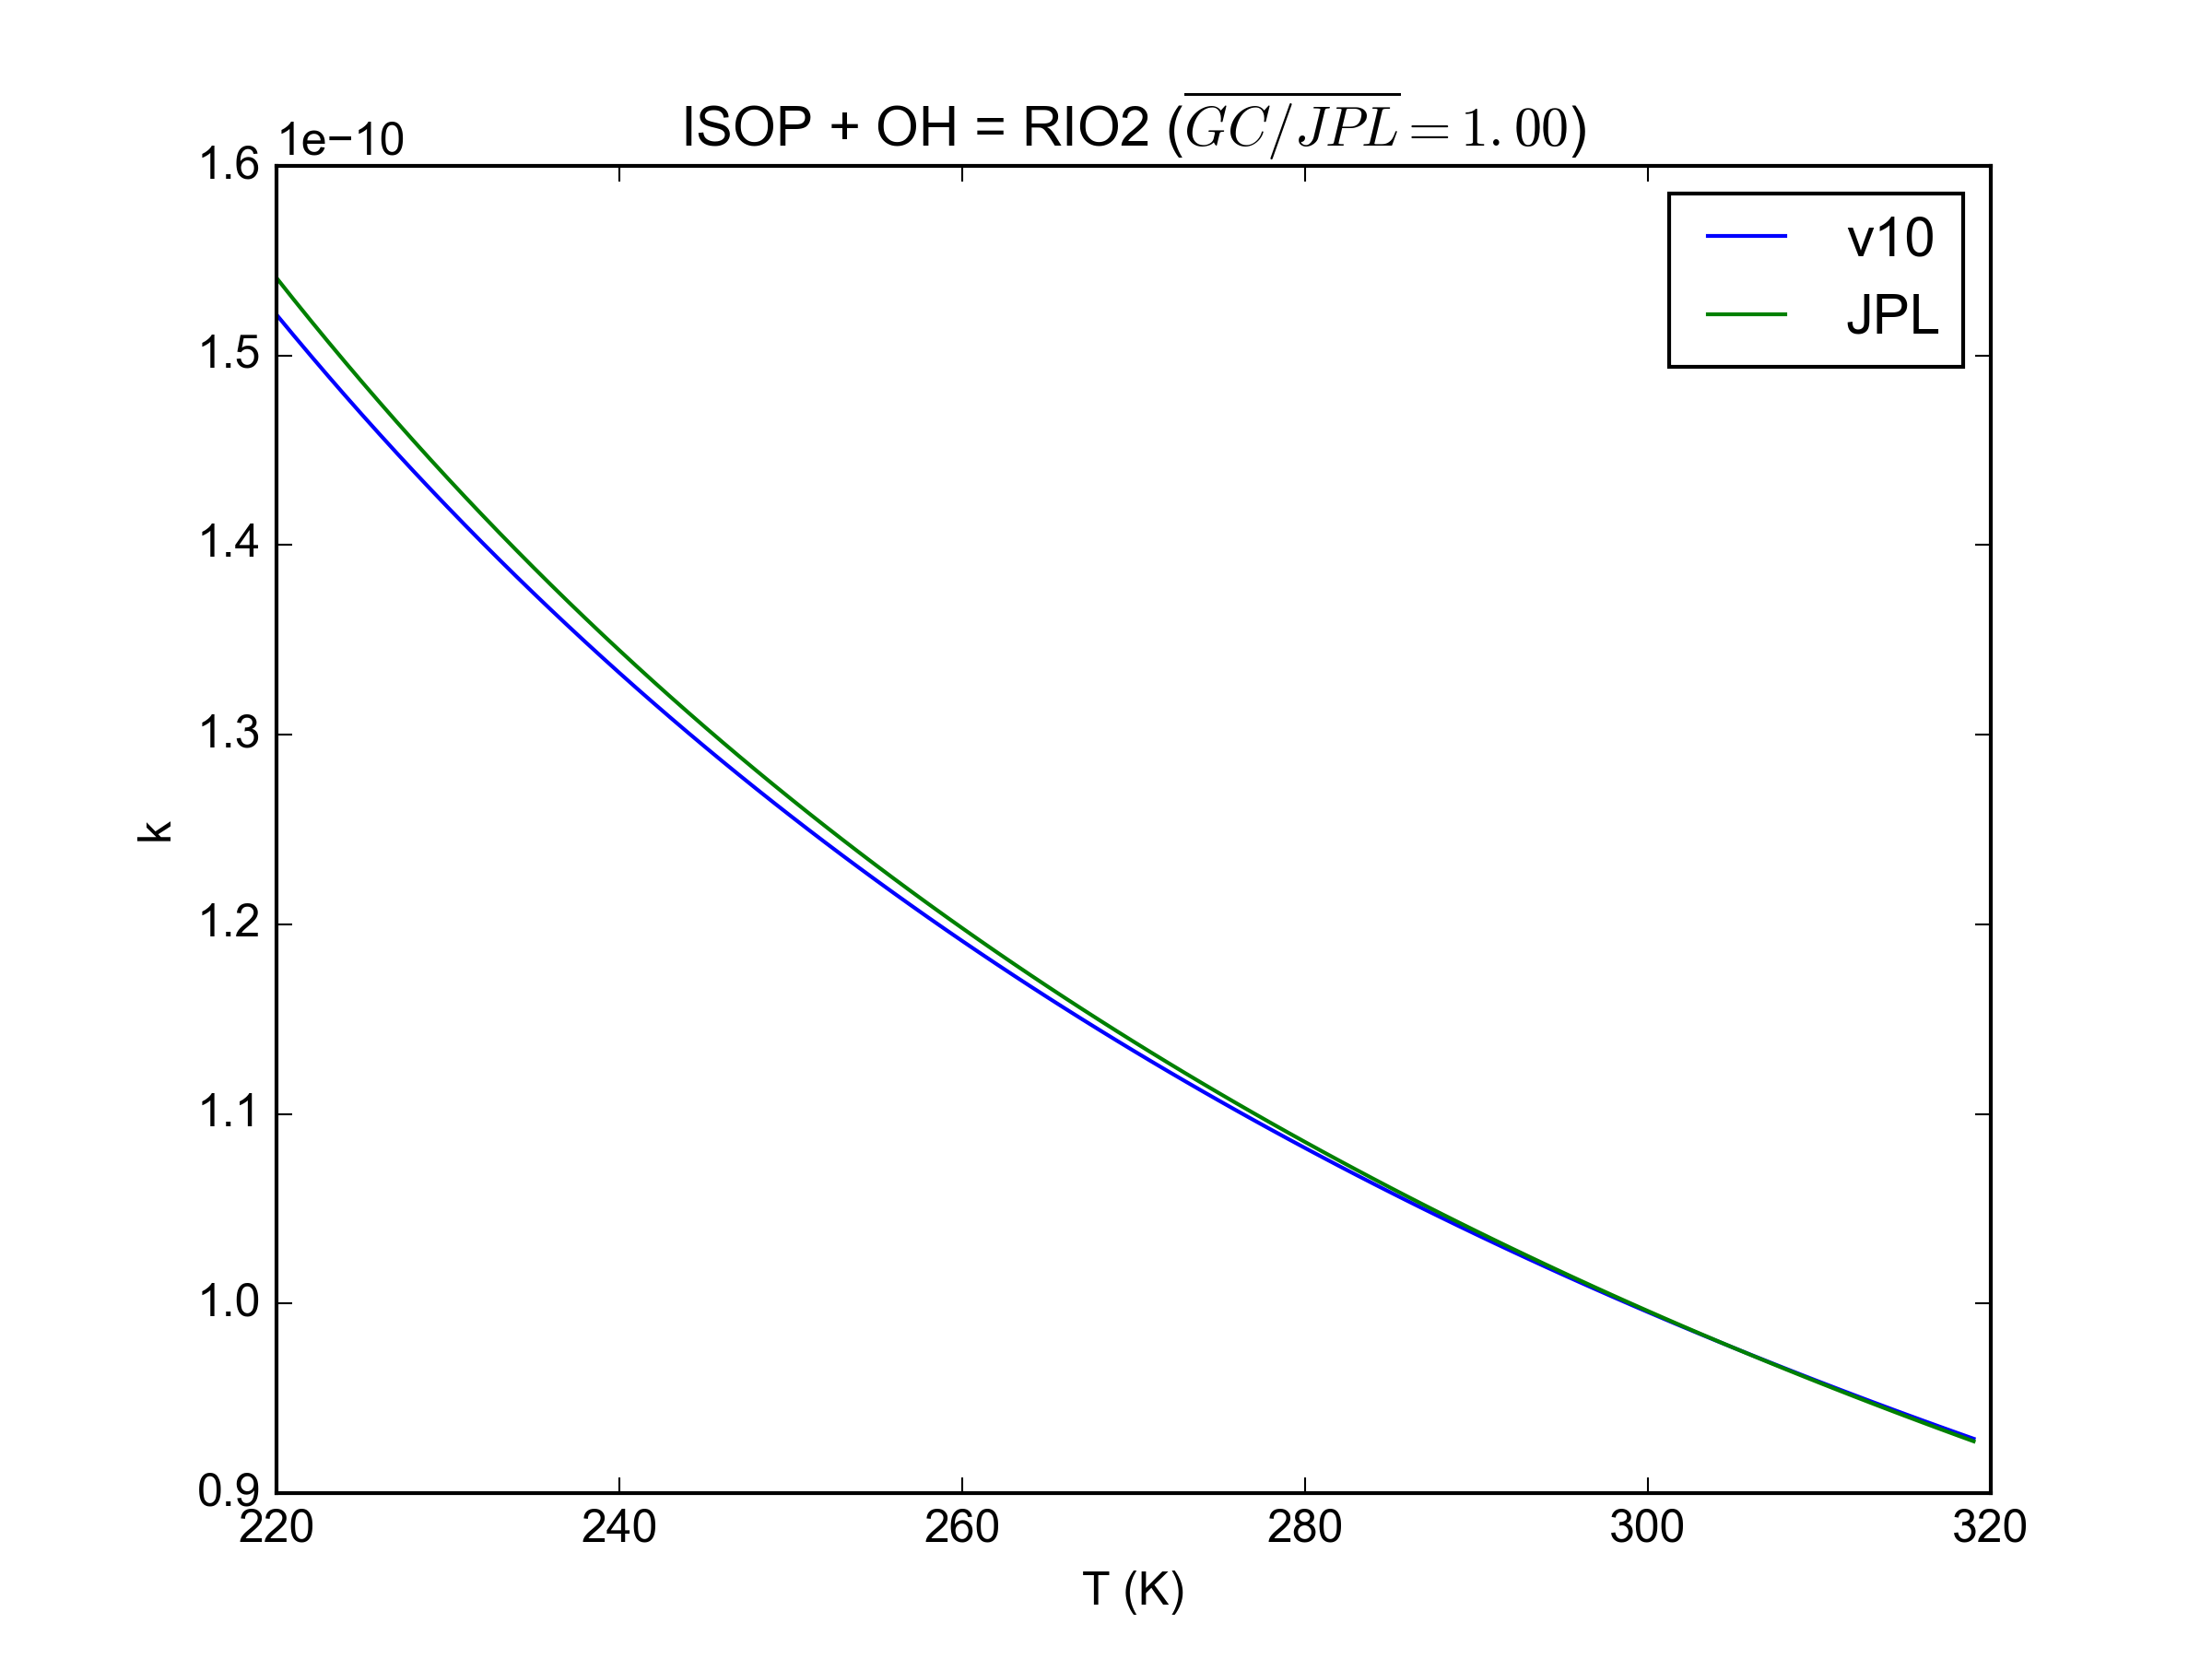
| 19:58, 3 May 2016 | JPL201510andGCv10 ISOPplOH eq RIO2.png (file) |  |
141 KB | Barronh | GCv10 and JPL 15-10 rate coefficient comparison for isoprene with hydroxyl radical | 1 |
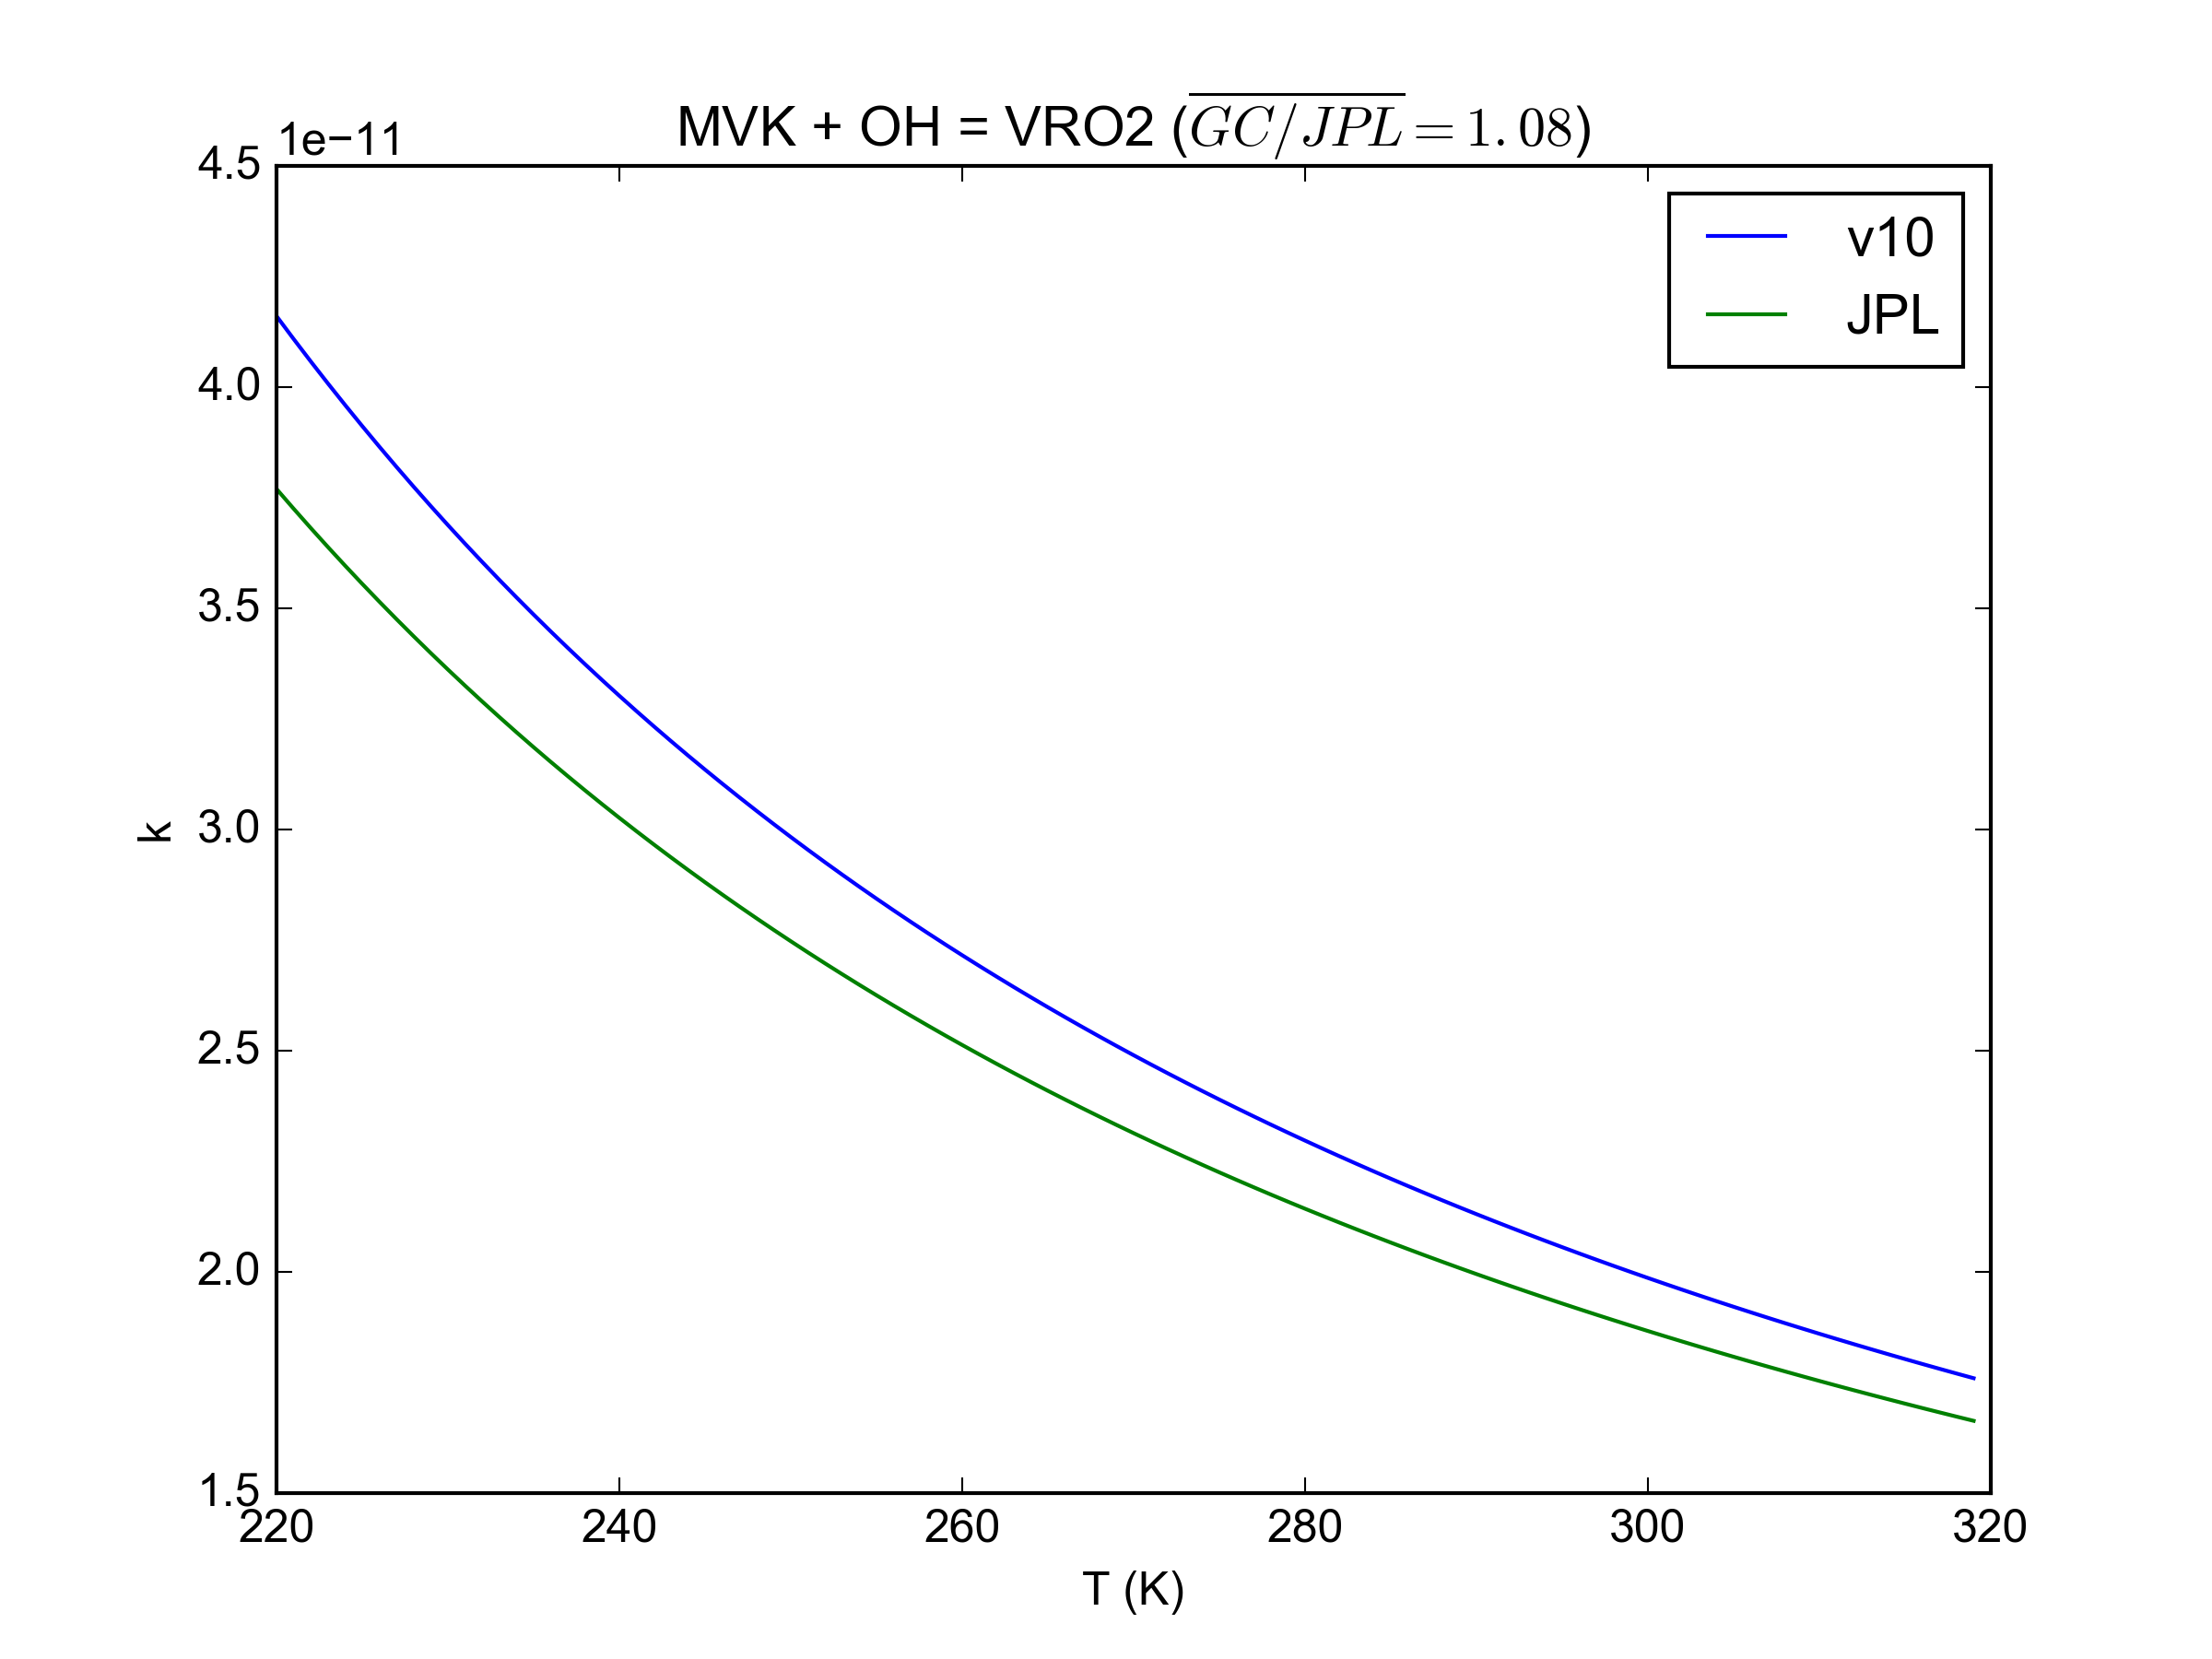
| 19:57, 3 May 2016 | JPL201510andGCv10 MVKplOH eq VRO2.png (file) |  |
145 KB | Barronh | GCv10 and JPL 15-10 rate coefficient comparison for methyl vinyl ketone with hydroxyl radical | 1 |
| 19:56, 3 May 2016 | JPL201510andGCv10 MACRplOH eq MAO3plMRO2.png (file) |  |
149 KB | Barronh | GCv10 and JPL 15-10 rate coefficient comparison for methacrolein with hydroxyl radical | 1 |
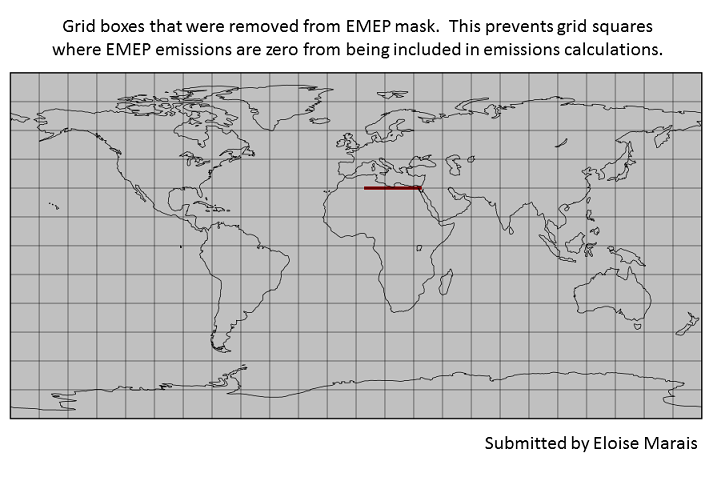
| 20:48, 6 January 2016 | Boxes removed from EMEP mask.png (file) |  |
97 KB | Bmy | Shows the grid boxes removed from the EMEP mask. | 1 |
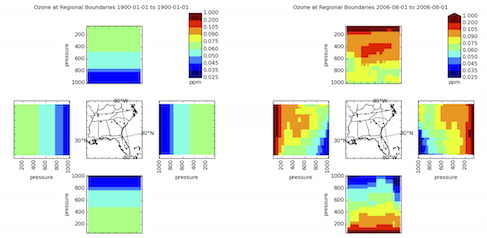
| 16:57, 8 September 2015 | Pncglobal2cmaq comparison.png (file) |  |
82 KB | Barronh | Comparison of standard BCON versus GEOS-Chem derived BCON. | 1 |
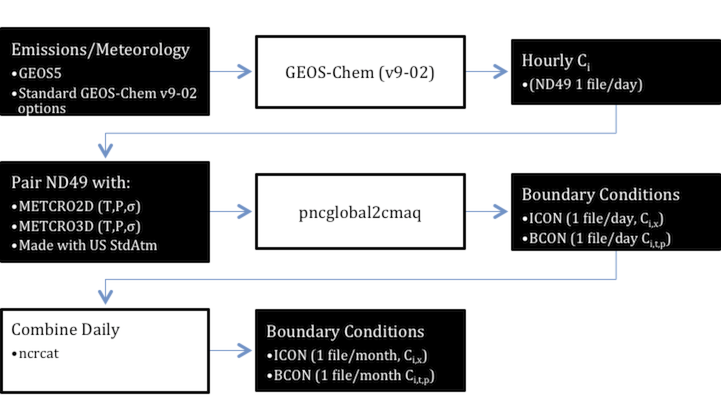
| 16:42, 8 September 2015 | Pncglobal2cmaq process.png (file) |  |
84 KB | Barronh | This figure visually describes the pncglobal2cmaq process. | 1 |
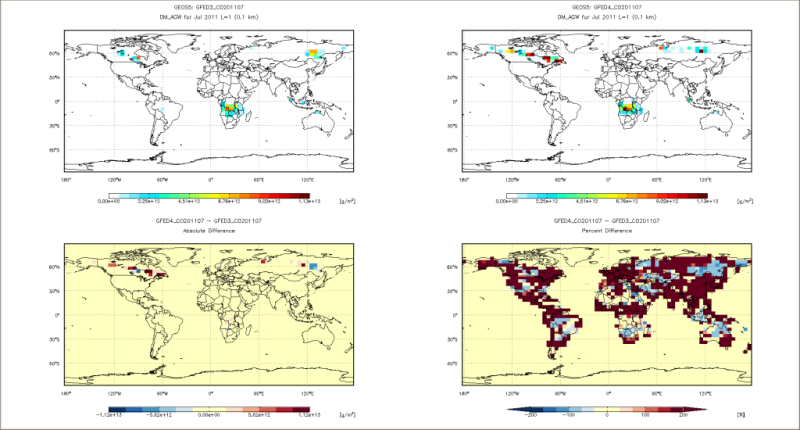
| 17:33, 27 March 2015 | GFED4 CO emissions from prasad.png (file) |  |
147 KB | Melissa Payer | Difference plots showing CO emissions computed offline for July 2011 and GFED4 for July 2013 (corresponding to what was used in the v10-01f_UCX and v10-01h benchmark runs) | 3 |
| 17:25, 27 March 2015 | V10-01 CO biomass emission diffs.gif (file) |  |
211 KB | Melissa Payer | CO biomass burning emissions from the 1-month benchmark for GEOS-Chem v10-01h | 3 |
First page |
Previous page |
Next page |
Last page |