Leaf area indices in GEOS-Chem
On this page we provide an overview of how leaf area index (LAI) data is used in GEOS-Chem. Leaf area index is defined as the total leaf surface area divided by the total surface area of a grid box (typical units are: cm2 leaf cm-2 GEOS-Chem grid box).
Yuan processed MODIS LAI
There is an issue under investigation with v6 of the Yuan processed MODIS LAI. For more details, see this GitHub issue.
The option to read Yuan processed MODIS LAI was turned ON by default in GEOS-Chem 12.7.0 (released 03 Feb 2020).
Barron Henderson wrote:
LAI products from MODIS come from many sources, some of which are more recent than the ones in GEOS-Chem at this time. I explored both the MODIS product using very basic processing and the product described by Yuan et al. 2011. I propose updating LAI to the product described by Yuan et al. 2011. This product is available from 2000 through 2015 and was previously applied with MEGAN by Sindelarova et al. (2014). I performed tests with GEOS-Chem v9-02 and saw generally consistent results.
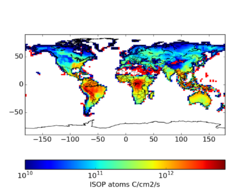
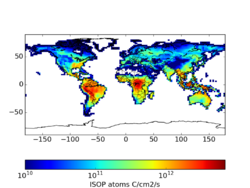
I processed LAI for 2008-2010 and simulated isoprene emissions for 2010 using both the product already in GEOS-Chem and the Yuan et al. (2011) product. LAI varies both intra and inter-annually. GEOS-Chem currently applies year-specific LAI for 2005-2009. Beyond 2009, GEOS-Chem currently uses LAI from 2008. Before 2005, GEOS-Chem currently uses LAI from 2005. By comparing LAI from 2008, we can understand the difference between LAI products. Looking at isoprene emissions from 2010 estimates the difference due to LAI product and the effect of interannual variability.
The differences between products (the product we currently use, basic processing of MODIS, and Yuan) is larger than the differences between years. The Yuan product having been used in Sindelarova (2014) with Guenther as a co-author and explicit discussion of better gap filling leads me to select the Yuan product.
Using the Yuan product reduces isoprene emissions by 4-7% per month (see File:README LAI BNU.txt). In specific locations, the differences can be quite high. These may be a combination of edge effects where spatial processing was different, gap filling, and a difference in the LAI maximum. Sindelarova et al (2014) applied the Yuan dataset with a 7 m2/m2 maximum, which was not applied in my tests and may account for some large differences. The largest differences occur in areas with the lowest emissions.
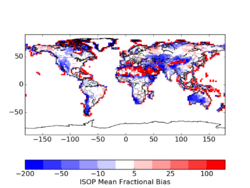
Standard From Yuan 2*(Yuan - STD)/(Yuan+STD) For 2010, there is not a huge difference that motivates a high priority implementation. However, upon further reflection, this update seems easy and practical. It also has the added benefit of providing a consistent product for a 15-year period.
- Yuan, H., Dai, Y., Xiao, Z., Ji, D., Shangguan, W., 2011. Reprocessing the MODIS Leaf Area Index Products for Land Surface and Climate Modelling. Remote Sensing of Environment, 115(5), 1171-1187. doi:10.1016/j.rse.2011.01.001,
- Sindelarova, K., Granier, C., Bouarar, I., Guenther, A., Tilmes, S., Stavrakou, T., Müller, J.-F., Kuhn, U., Stefani, P., and Knorr, W.: Global data set of biogenic VOC emissions calculated by the MEGAN model over the last 30 years, Atmos. Chem. Phys., 14, 9317-9341, doi:10.5194/acp-14-9317-2014, 2014.


--barronh 11:30, 4 Nov 2016 (EDT) edited drastically at 2:08pm.
Jenny Fisher followed up on 5/31/2018:
I have downloaded and processed the Yuan BNU MODIS LAI product for 2005-2016.
- There are a couple of caveats:
- The MODIS LAI files seem to be some of the only lingering files left that are NOT read by HEMCO. This means that there is a bunch of hardcoding associated with reading the files. And a few issues associated with that:
- Although the files are provided at very high resolution (and I could have regridded to match GEOS-Chem resolution, or something else that would be useful in future), I had to maintain these at generic 0.25°x0.25° to match what was already done in modis_lai_mod.F
- The new files operate on a different time basis (weekly vs. monthly) so there were a number of hardcoded changes required to facilitate weekly reading.
- I haven’t benchmarked the impact of the changes. Barron did this when he prepared some of the files (that’s what is on the wiki page you linked to), but I prepared my versions separately (and slightly differently, i.e. including a maximum LAI value) so the comparison would look different.
For #1 – I think the issues would be solved if GCST could translate the existing MODIS LAI reading code into HEMCO (as HEMCO could handle the different resolutions and time periods). Is that a possibility?
For #2 – unfortunately I don’t have the resources to do any extra runs at the moment, so I can’t test the global impacts. But assuming this update is not coupled with other isoprene emission updates, the normal GCST benchmarking procedure would show us how much impact it had.
Lizzie Lundgren wrote:
I believe the hard-coded regridding of MODIS LAI from fine to coarse resolution within GEOS-Chem Classic is due to the dependence on the Olson land map for regridding. I don’t think HEMCO currently has the capacity to do this, but Christoph please correct me if I am wrong. We actually bypass the hard-coded regridding entirely in GCHP and use MAPL ExtData instead. However, this required GMAO to implement a fractional regridding algorithm within ExtData which GMAO graciously did for us. I wonder if we could do something similar in HEMCO?
Christoph Keller wrote:
What I did in GEOS-5 (prior to the ExtData update) was to create a separate mask for every Olson land type, which can then be regridded using the regular regridding routines. This could be a workaround for GC classic.
Chris Holmes wrote:
After corresponding with Mike Barkley and Jenny and reading Yuan et al. (2011) LAI paper, I have a few key messages.
- 1 The Yuan et al. (2011) LAI dataset includes spatial interpolation and temporal smoothing that substantially mitigate the noise and gaps in the 8-day MODIS LAI product. Examples in the paper and provided by Jenny look reasonable.
- We should implement this LAI dataset in GEOS-Chem.
- We should *not* call this dataset “MODIS LAI” because it’s highly processed and quite different from the original MODIS LAI.
We now refer to this dataset Yuan processed MODIS LAI.
--Bob Yantosca (talk) 19:17, 8 March 2019 (UTC)
Quick fix to use Yuan-processed MODIS LAI in GEOS-Chem Classic
Bob Yantosca discovered an error when using the Yuan-processed MODIS LAI data in GEOS-Chem "Classic" simulations. HEMCO cannot locate the proper bounding timestamps for the interpolation.
Example: HEMCO should have detected that simulation date 20160701 was bounded by data timestamps 20160624 and 20160704, and should have interpolated accordingly. Instead, HEMCO was detecting that simulation data 20160701 was bounded by data timestamps 20160602 and 20160610. This is clearly wrong.
Christoph Keller traced this error to routine GET_TIMEIDX in module HEMCO/Core/hcoio_read_std_mod.F90, which is only used for GEOS-Chem "Classic" simulations. The search algorithm was continuing to look for timestamps further back in time than was necessary.
If you need to run GEOS-Chem simulations with the Yuan-processed MODIS LAI data, Christoph Keller has submitted a quick fix. Add the IF statement in GREEN to this code in hcoio_read_std_mod.F90. This will force the timestamp search algorithm to terminate before it goes too far back in time.
       ! -------------------------------------------------------------
       ! Check if we need to continue search. Even if the call above
       ! returned a time slice, it may be possible to continue looking
       ! for a better suited time stamp. This is only the case if
       ! there are discontinuities in the time stamps, e.g. if a file
       ! contains monthly data for 2005 and 2020. In that case, the
       ! call above would return the index for Dec 2005 for any
       ! simulation date between 2005 and 2010 (e.g. July 2010),
       ! whereas it makes more sense to use July 2005 (and eventually
       ! interpolate between the July 2005 and July 2020 data).
       ! The IsClosest command checks if there are any netCDF time
       ! stamps (prior to the selected one) that are closer to each
       ! other than the difference between the preferred time stamp
       ! prefYMDhm and the currently selected time stamp
       ! availYMDhm(tidx1a). In that case, it continues the search by
       ! updating prefYMDhm so that it falls within the range of the
       ! 'high-frequency' interval.
       ! -------------------------------------------------------------
       ExitSearch = .FALSE.
       IF ( Lct%Dct%Dta%CycleFlag == HCO_CFLAG_EXACT ) THEN
          ExitSearch = .TRUE.
       ELSE IF ( tidx1a > 0 ) THEN
          ExitSearch = IsClosest( prefYMDhm, availYMDhm, nTime, tidx1a )
       ENDIF
       !### for testing, only apply to containers with “XLAI” in the name
       IF ( INDEX( Lct%Dct%Cname, 'XLAI' ) > 0 ) THEN
          ExitSearch = .true.
       ENDIF
We will try to add a more robust fix for this issue in the near future. We did not want to add a fix that was contingent on a HEMCO container name to the standard code.
NOTE: GCHP is unaffected by this issue, as it uses the MAPL ExtData functionality to read data from disk. We have verified that GCHP reads in the Yuan-processed MODIS LAI data properly.
--Bob Yantosca (talk) 19:36, 7 June 2019 (UTC)
References
- Yuan, H., Dai, Y., Xiao, Z., Ji, D., Shangguan, W., 2011. Reprocessing the MODIS Leaf Area Index Products for Land Surface and Climate Modelling. Remote Sensing of Environment, 115(5), 1171-1187. doi:10.1016/j.rse.2011.01.001. (Web: http://globalchange.bnu.edu.cn/research/lai)
--Bob Yantosca (talk) 19:05, 8 March 2019 (UTC)
Obsolete information
Overview

Prior to the official release of GEOS-Chem v9-01-03, GEOS-Chem used leaf area index data in the following manner:
LAI used by dry deposition and soil NOx emissions
Prior to April 2012, GEOS-Chem used leaf area index (LAI) data from separate sources. The dry deposition and soil NOx emissions modules utilized the data stored in ASCII files named lai*.global. These files (one per month) were created (using offline IDL routines) for each specific GEOS-Chem grid configuration (i.e. 4° x 5°, 2° x 2.5°, and 0.5° x 0.666° nested grids, etc.). The lai*.global files were read from disk by routines readlai.F and rdlai.F, which saved the LAI data into arrays named XLAI (in CMN_DEP_mod.F) and XYLAI (in CMN_VEL_mod.F).
The XLAI and XYLAI arrays contain leaf area index as a function of Olson land type (cf Olson 1992 land map). The XLAI array has dimensions (IIPAR,JJPAR,NTYPE), where IIPAR is the number of longitudes in the horizontal grid, JJPAR is the number of latitudes, and NTYPE is the number of individual Olson land types per each GEOS-Chem grid box. The XYLAI array contained the same data as in XYLAI, but for historical reasons was dimensioned with only one spatial dimension: (IIPAR*JJPAR,NTYPE).
Please note that there is a direct correspondence between the LAI data stored in the lai*.global files (and saved into XLAI and XYLAI arrays) and the Olson land map. Therefore, if you are using the Olson 1992 land map (native resolution 0.5° x 0.5°, default in GEOS-Chem), then you must also use LAI data at 0.5° x 0.5° native resolution. On the other hand, if you are using the Olson 2001 land map (native resolution 0.25° x 0.25°), then you must also use LAI data at 0.25° x 0.25° resolution.
GEOS-Chem users had the option to use either LAI data from the AVHRR satellite instrument or the MODIS satellite instrument. Individual sets of lai*.global files were prepared for both AVHRR LAI and MODIS LAI data. Users could select either AVHRR LAI or MODIS LAI with a switch in the input.geos file. Customary usage is to select the MODIS LAI data, for reasons explained HERE.
--Bob Y. 14:57, 21 May 2012 (EDT)
A bug for reading LAI index for nested models
I find that there is something worry for reading LAI index when I check the calculation of dry deposition velocity in DRYDEP_MOD.f in GEOS-Chem v8-03-02. I simulated the ozone concentrations by GEOS-Chem version 8-03-02 with global domain (2x2.5), Asia domain (0.5x0.667), Europe domain (0.5x0.667) and North America domain (0.5x0.667). The simulated results of surface ozone in nested domains (North America and Europe) is much higher than global model (2x2.5). Then, I examine the dry deposition velocity in the four models, finding that nested models of North America and Europe is much lower than global model by up to 25%-30% and the pattern of dry deposition in the two nested models is probably wrong. At last, I find out that the data set of lai*.global in MODIS_LAI_200911 directory for nested models is missing in http://rain.ucis.dal.ca/.
--Yingying Yan 21:34, 8 December 2014 (EDT)
LAI used by MEGAN biogenic emissions
The MEGAN biogenic emissions module also relies on MODIS LAI data. Prior to April 2012, routine RDISOLAI (in lai_mod.F) read MODIS LAI at 1° x 1° native resolution from files in binary punch format. The LAI data was regridded on-the-fly to GEOS-Chem resolution and stored in arrays named ISOLAI (daily LAI), PMISOLAI (LAI for previous month), MISOLAI (LAI for this month), and NMISOLAI (LAI for next month), all contained within module lai_mod.F. The MEGAN module took the MODIS LAI data directly from these arrays.
When modifications were made for the GEOS-5 0.5° x 0.666° nested grids, separate subroutines were added into lai_mod.f to read from LAI data sets that were specifically regridded to each 0.5° x 0.666° nested grid window (China/SE Asia, N. America, and Europe). This added another layer of complexity on top of an somewhat already overburdened code.
--Bob Y. 14:58, 21 May 2012 (EDT)
LAI used by the mercury simulation
Prior to April 2012, in the GEOS-Chem mercury simulation, the routine which computes Hg emission from soils (SOILEMIS, in module land_mercury_mod.F) used the daily averaged LAI (stored in the ISOLAI array of lai_mod.F) in order to attenuate solar radiation. As mentioned above, this LAI data was first read in from disk at 1° x 1° resolution and then regridded to the current GEOS-Chem resolution. --Bob Y. 14:59, 21 May 2012 (EDT)
Issues that needed to be resolved
These different sources of LAI data (i.e. one data set stored in the lai*.global files at GEOS-Chem resolution, one data stored in binary files at 1° x 1° native resolution, and the special data sets for the 0.5° x 0.666° nested grids) presented an inconsistency that had to be resolved in order for GEOS-Chem development to advance towards full grid independence.
Furthermore, for the GEOS-Chem HP project we must migrate away from ASCII files (which prevent efficient interfacing with external GCMs). We also cannot assume any particular horizontal grid, since that is now to be specified by the external GCM. Therefore, we must instead read the LAI data from disk at the same native resolution, and from this, populate the arrays that are used by the dry deposition, soil NOx emissions, and MEGAN biogenic emissions modules.
Finally, to facilitate simulations at ultra-fine horizontal resolution, we will adopt the Olson 2001 land map, which has a native resolution of 0.25° x 0.25°. We will also use an updated version of the MODIS LAI data at 0.25 x 0.25 resolution. We needed to have a flexible mechanism that will allow us to switch between LAI data at different native horizontal resolutions.
--Bob Y. 15:01, 21 May 2012 (EDT)
Implementation of an updated LAI code
>In GEOS-Chem 12.3.0 and later versions, leaf area index data is read via HEMCO. The code discussed below has since been removed.
This update was tested in the 1-month benchmark simulation v9-01-03j and approved on 17 Apr 2012.
To resolve the issues discussed in the preceding section, the GEOS-Chem Support Team has created the following new GEOS-Chem modules:
- olson_landmap_mod.F90
- Used to read in the Olson land cover map directly from netCDF files at its native resolution (0.5° x 0.5° if using Olson 1992, 0.25° x 0.25° if using Olson 2001). This removes the need for obsolete ASCII files. Please see our Olson land map wiki page for a complete description.
- modis_lai_mod.F90
- This module replaces the existing GEOS-Chem module lai_mod.F. Using the Olson land map information supplied by olson_landmap_mod.F90, the routines in modis_lai_mod.F90 perform the following tasks:
- Read MODIS LAI data from netCDF files at its native resoluton (either 0.5° x 0.5° or 0.25° x 0.25°, depending on which Olson land map version is used)
- Regrid MODIS LAI data to the current GEOS-Chem resolution on-the-fly.
- Populate the XLAI array for backwards compatibility with the existing legacy Dry deposition and Soil NOx emissions modules.
- Populate LAI arrays that are needed for MEGAN biogenic emissions and the Mercury simulation.
- mapping_mod.F90
- Used to pass land type and regridding information from olson_landmap_mod.F90 to modis_lai_mod.F90.
For the MEGAN biogenic emissions and Mercury simulations, we have now replaced variables from lai_mod.F with the corresponding variables from modis_lai_mod.F90 as shown in this table:
| Variable | Type | Which stores this quantity | In this module | Is now replaced by | In this module |
|---|---|---|---|---|---|
| ISOLAI | array | Daily interpolated leaf area index [cm2 cm-2] | lai_mod.F | GC_LAI | modis_lai_mod.F90 |
| PMISOLAI | array | Previous month's leaf area index, as read from disk [cm2 cm-2] | lai_mod.F | GC_LAI_PM | modis_lai_mod.F90 |
| MISOLAI | array | Current month's leaf area index, as read from disk [cm2 cm-2] | lai_mod.F | GC_LAI_CM | modis_lai_mod.F90 |
| NMISOLAI | array | Next month's leaf area index, as read from disk [cm2 cm-2] | lai_mod.F | GC_LAI_NM | modis_lai_mod.F90 |
| DAYS_BTW_M | scalar | # of days between the start of 2 successive LAI months | lai_mod.F | DAYS_BTW_MON | modis_lai_mod.F90 |
We have also taken the opportunity to replace the obsolete XYLAI array with XLAI, which has allowed us to retire the obsolete legacy code module CMN_VEL_mod.F. We will keep the XLAI array for compatibility with the dry deposition module for the foreseeable future (at least until the dry deposition module is modernized).
--Bob Y. 15:11, 17 December 2012 (EST)
Validation
The following sections describe how we have validated the new leaf area index scheme in GEOS-Chem.
Using Olson 1992 land map
NOTE: The Olson 1992 land map is now de-supported in GEOS-Chem 12.
NOTE: The new leaf area index algorithm with Olson 1992 land map was also validated with 1-month benchmark v9-01-03j.
We have tested the implementation of the new LAI scheme with 1-month benchmarks. We used the Olson 1992 land map (which is the default in GEOS-Chem) and MODIS LAI data, both at 0.5° x 0.5° resolution. Here are our results:
1. Because we are now regridding MODIS LAI from finer resolution than 1° x 1°, the LAI stored in arrays in modis_lai_mod.F90 (i.e. in arrays GC_LAI, GC_LAI_PM, GC_LAI_CM and GC_LAI_NM) differ slightly when compared to GEOS-Chem output using LAI that was regridded from 1° x 1°. In general, individual LAI values at a particular grid box will generally agree to the first 3 decimal places. This will cause slight differences in the emissions of biogenic species computed by MEGAN.
2. The plot below compares the LAI (stored in the ISOLAI array of lai_mod.F) from v9-01-03i, to LAI computed by the updated scheme (stored in the GC_LAI array of modis_lai_mod.F90). Monthly mean LAI from v9-01-03i is shown on the top left panel and monthly mean LAI from the updated scheme is shown on the top right panel.

As you can see, maximum difference for this month is less than 0.2 cm2 cm-2. As mentioned in point #1 above, we attribute this to regridding from 0.5° x 0.5° native resolution.
3. We have also confirmed that the updated LAI scheme generates identical XLAI arrays w/r/t the old scheme used in v9-01-03i. This causes the Dry deposition and Soil NOx emissions codes to behave in precisely the same way as before. This is evidenced by the following plot comparing O3 dry deposition velocities (cm s-1) from GEOS-Chem v9-01-03i (left top panel) and GEOS-Chem with the updated LAI scheme (right top panel).

We have performed a 1-month benchmark (July 2005, using 4° x 5° GEOS-5 met data) using the new LAI scheme and have compared that to v9-01-03i. ISORROPIA was turned off in both simulations to negate the random numerical noise error. The following plots and tables show very minor differences in tracer concentrations and emissions.
| Quantity being plotted | Plot | Remarks |
|---|---|---|
| Frequency distribution histogram | Click HERE to view | Most species have close to 100% of data points within the central bar. ISOP and its products have some spread, but that is likely due to small numerical differences. |
| Emissions table | Click HERE to view | NOTE: isoprene emissions |
| Emissions ratio for isoprene | Click HERE to view | For ISOP, the differences in ratio tend to occur where ISOP concentrations are already very small. |
| Absolute differences @ surface and 500hPa, all species (using fixed data ranges) | Click HERE to view | |
| Absolute differences @ surface and 500hPa, all species (using the dynamic range of the data) | Click HERE to view | Many species have abs diffs less than +/-0.05 ppbv. The largest differences are ISOP (+/-0.7 ppbC) and CO (+/-0.6 ppbv). These differences are likely well within the level of the uncertainties of the emissions data. |
| Zonal mean differences, all species (using fixed data ranges) | Click HERE to view | |
| Zonal mean differences, all species (using the dynamic range of the data) | Click HERE to view | All species show very small zonal mean differences, typically +/-0.2 ppbv or less. |
Conclusions
- Neither dry deposition nor soil NOx emissions are responsible for the differences seen in the plots & tables above
- Regriding LAI from 0.5° x 0.5° (as opposed to 1° x 1°) causes slight numerical differences in the daily interpolated LAI values, which in turn, causes minor differences in biogenic emissions computed by MEGAN. This is reponsible for the the differences seen in the plots and tables above.
--Bob Y. 15:12, 13 April 2012 (EDT)
Using Olson 2001 land map
Switching from the Olson 1992 land map to the Olson 2001 land map seems to produce very different results in the GEOS-Chem full-chemistry simulation. The plot below shows the monthly average of daily-interpolated LAI values in a GEOS-Chem simulation with GEOS-5 met fields at 4° x 5° resolution. The left panel shows the monthly-mean LAI from v9-01-03i; the right panel is taken from a 1-month benchmark using the Olson 2001 land map and MODIS LAI (both at 0.25° x 0.25° native resolution). The absolute and percent differences are also plotted.

As you can see there is a marked discrepancy in the LAI values. The new LAI values over the Amazon lower by ~1 cm2 cm-2, and by approximately 0.5 cm2 cm-2 over much of North America.
Eloise Marais wrote:
I think these differences make sense, based on the changes to the Olson 2001 landcover map. The Olson 2001 landcover map defines many of the gridsquares in the tropics as degraded forest, woodlands, or tree crops, leading to a reduction in LAI.
--Emarais 16:59, 13 April 2012 (EDT)
These differences daily LAI also apparently impact the dry deposition velocities, as seen in the following plot. Here we plot the O3 dry deposition velocity (cm s-1) from v9-01-03i (top left panel) vs. O3 dry deposition velocity computed using the Olson 2001 land map and MODIS LAI, both at 0.25° x 0.25° native resolution:

We have performed a 1-month benchmark (July 2005, using 4° x 5° GEOS-5 met data) using the updated LAI scheme with the Olson 2001 land map, and have compared that to v9-01-03i. ISORROPIA was turned off in both simulations to negate the random numerical noise error. The following plots and tables show substantial differences in tracer concentrations and emissions.
| Quantity being plotted | Plot | Remarks |
|---|---|---|
| Frequency distribution histogram | Click HERE to view | Many species show significant spread away from the central bar of the histogram. |
| Emissions table | Click HERE to view | NOTE: isoprene emissions decrease by 3.5 Tg C. Differences of -0.1 to -0.6 ppbC are also apparent in the other biogenic species. Soil NOx emissions decrease by -0.033 Tg N. |
| Emissions ratio for isoprene | Click HERE to view | In places where isoprene concentrations are already low, the new land map and LAI make these emissions go even lower (often by more than half). |
| Absolute differences @ surface and 500hPa, all species (using fixed data ranges) | Click HERE to view | NOx changes at the surface by +/-2ppb; Ox by up to +/-6ppb; ISOP by up to -6ppbC over the Amazon. |
| Absolute differences @ surface and 500hPa, all species (using the dynamic range of the data) | Click HERE to view | |
| Zonal mean differences, all species (using fixed data ranges) | Click HERE to view | |
| Zonal mean differences, all species (using the dynamic range of the data) | Click HERE to view |
It should be noted that these differences may not just be due to regridding from 0.25° x 0.25° to 4° x 5° resolution. The Olson 2001 land map uses a different land type numbering system than the Olson 1992 land map, which may cause the dry deposition and emission algorithms to function differently than in previous versions.
--Bob Y. 15:18, 13 April 2012 (EDT)
Eloise Marais wrote:
The isoprene emissions ratio plot (3rd entry in the above table) is reasonable, as the coastal regions experience the largest change in LAI in going from MODIS LAI at 0.5x0.5 degrees to MODIS LAI at 0.25x0.25 degrees as input for estimating isoprene emissions in MEGAN. Regions where isoprene emissions are most important (such as the tropics year-round and the southeast US in JJA) are unchanged by the new MODIS LAI fields.
--Emarais 16:59, 13 April 2012 (EDT)
Updates for GEOS-Chem v11-01
These updates were validated with 1-month benchmark GEOS-Chem v11-01b (approved 04 Aug 2015).
Matthew Johnson has provided the following data files, which will be added to v11-01b as part of the online emission of marine POA update:
- Added monthly MODIS-Aqua chlorophyll-A data files for all years for which we have LAI data as well as through 2014.
For more information, please see the chlorophyll-A data section of the following README files:
- ExtData/CHEM_INPUTS/MODIS_LAI_201204/For_Olson_1992/README
- ExtData/CHEM_INPUTS/MODIS_LAI_201204/For_Olson_2001/README
NOTE: LAI data was also provided for additional years (2009 through 2011) but is not currently used in v11-01 pending validation.
--Lizzie Lundgren (talk) 15:47, 16 July 2015 (UTC)