File:Example DRE figures.jpg
From Geos-chem

Size of this preview: 516 × 599 pixels. Other resolution: 207 × 240 pixels.
Original file (1,266 × 1,470 pixels, file size: 402 KB, MIME type: image/jpeg)
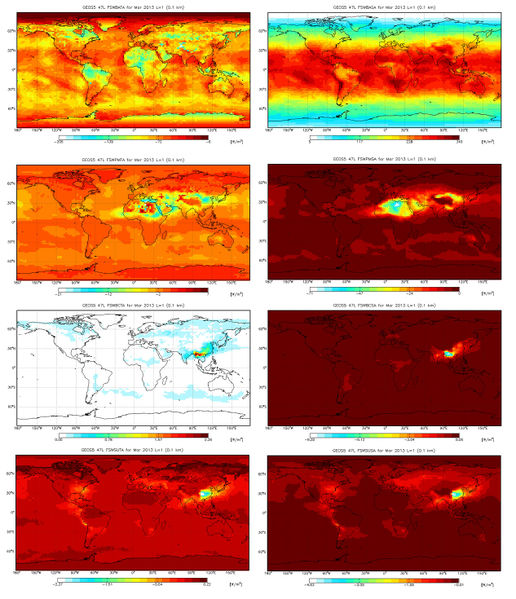
Example output fluxes and direct radiative effect (DRE) from GCRT for March 2013. The top row show the total flux with all aerosol and gases included, subsequent rows show the DRE for all particulate matter, black carbon, and sulfate. The left column shows top of atmosphere (TOA) and the right column shows surface DRE. All results are for all-sky conditions (i.e. including clouds).
File history
Click on a date/time to view the file as it appeared at that time.
| Date/Time | Thumbnail | Dimensions | User | Comment | |
|---|---|---|---|---|---|
| current | 16:15, 9 October 2013 | | 1,266 × 1,470 (402 KB) | David Ridley (Talk | contribs) | Example output fluxes and direct radiative effect (DRE) from GCRT for March 2013. The top row show the total flux with all aerosol and gases included, subsequent rows show the DRE for all particulate matter, black carbon, and sulfate. The left column show |
| 16:14, 9 October 2013 | Error creating thumbnail: File missing | 1,800 × 2,100 (1.85 MB) | David Ridley (Talk | contribs) | Example output fluxes and direct radiative effect (DRE) from GCRT for March 2013. The top row show the total flux with all aerosol and gases included, subsequent rows show the DRE for all particulate matter, black carbon, and sulfate. The left column show |
- You cannot overwrite this file.
File usage
The following page links to this file: